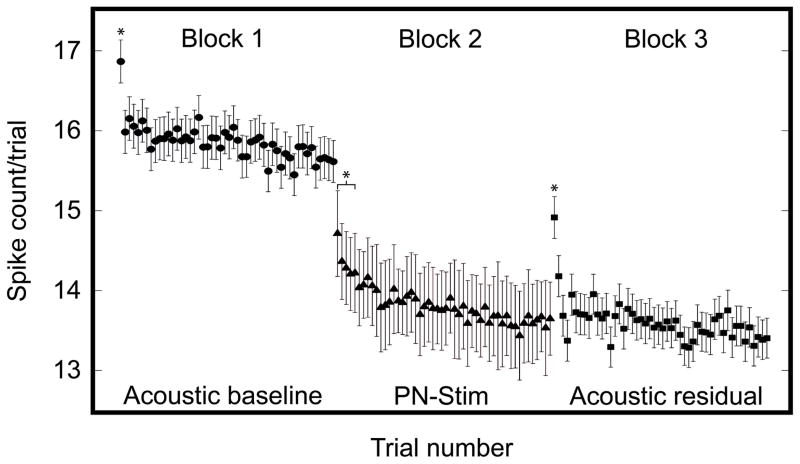
Figure 13. Suppression of neural firing in CNIC due to PN-Stim over time.
The mean and standard error of spike counts per trial are plotted for the Acoustic baseline (circles; n=960), PN-Stim (triangles; n=2,577), and Acoustic residual (squares; n=960) conditions. Within each block, trials occurred at 500 ms intervals. Between blocks, there was a delay of approximately 5–10 seconds. For Block 1 (Acoustic baseline) and Block 3 (Acoustic residual), we used the CNIC sites which were significantly suppressed during PN-Stim by at least one of the four AC stimulation sites. For these blocks, trial numbers correspond directly to the inter-trial separation of 500 ms. For Block 2 (PN-Stim), we used all A1-CNIC site pairs which were significantly suppressed. For the PN-Stim block, trial numbers do not necessarily correspond directly to the inter-trial separation since the 16 PN-Stim parameters were presented in a pseudorandom order. Instead the trial numbers of the PN-Stim block correspond to an average inter-trial separation of approximately 8 s (equal to 500 ms times 16 PN-Stim parameters). Asterisks correspond to trials with spike counts that are significantly higher than that of the last (50th) trial within the same block using Welch’s unequal variance, one-sided t-test with p<0.01. The significant bracket in Block 2 corresponds to trials 1 through 5.

