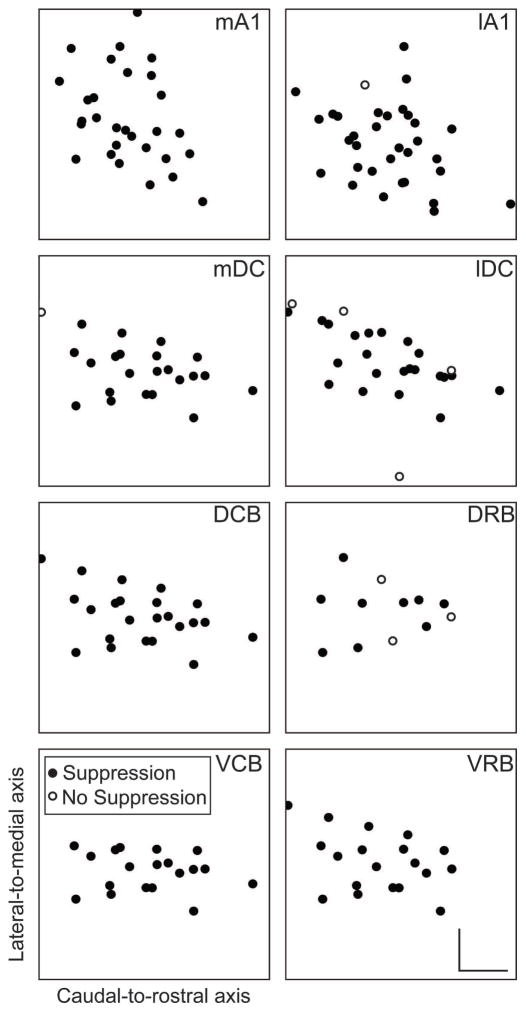
Figure 7. Distribution of suppression across the isofrequency laminae of CNIC during PN-Stim.
Squares representing an isofrequency lamina of the CNIC are plotted for stimulation of eight cortical regions based on three-dimensional computer reconstructions of the midbrain. A planar cut was made through the midbrain reconstruction perpendicular to the tonotopic gradient at a location that represents a middle frequency of approximately 8 kHz. Each panel is normalized similarly in the caudal-to-rostral and lateral-to-medial directions based on the furthest point determined to be inside the CNIC across our mapping studies (Markovitz et al., 2013). Filled circles represent locations in which PN-Stim induced significant suppression on at least one site along the shank that passed through this lamina. Open circles represent locations in which no CNIC suppression was induced by PN-Stim. These plots show that suppression could be induced across an isofrequency lamina by stimulating each cortical region. Scale bars in the bottom-right panel represent 0.5 mm. Abbreviations: mA1, medial portion of primary auditory cortex; lA1, lateral portion of primary auditory cortex; mDC, medial dorsocaudal area; lDC, lateral dorsocaudal area; DCB, dorsocaudal belt; DRB, dorsorostral belt; VCB, ventrocaudal belt; VRB, ventrorostral belt.

