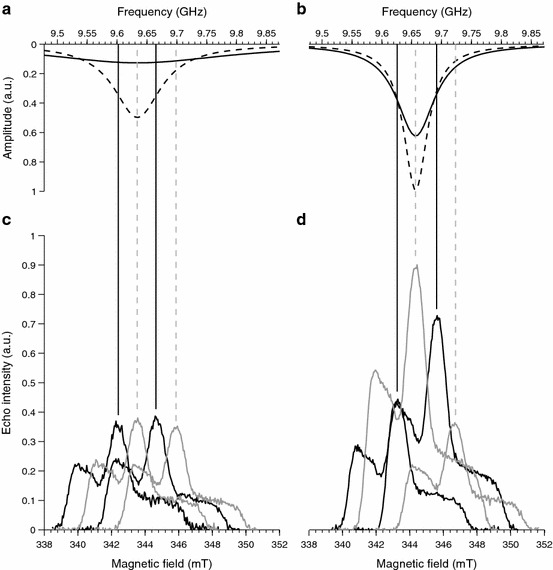
Fig. 3.

Upper panels, reconstruction of the sensitivity profiles (solid lines) and simulation of the resonator mode (dashed lines) with a Q = 100 and b Q = 200 as described in the main text. The vertical lines correspond to microwave frequencies used to set up the PELDOR experiments. The lower panels report the EDFS spectra recorded at each frequency with c Q ≈ 100 and d Q ≈ 200. The amplitude of the microwave channel was varied at each frequency to maximize the signal amplitude. Color code: gray lines correspond to the standard configuration (pump = ν center; observer = ν center + 65 MHz); black lines correspond to the symmetric configuration (pump = ν center − 32.5 MHz; observer = ν center + 32.5 MHz)
