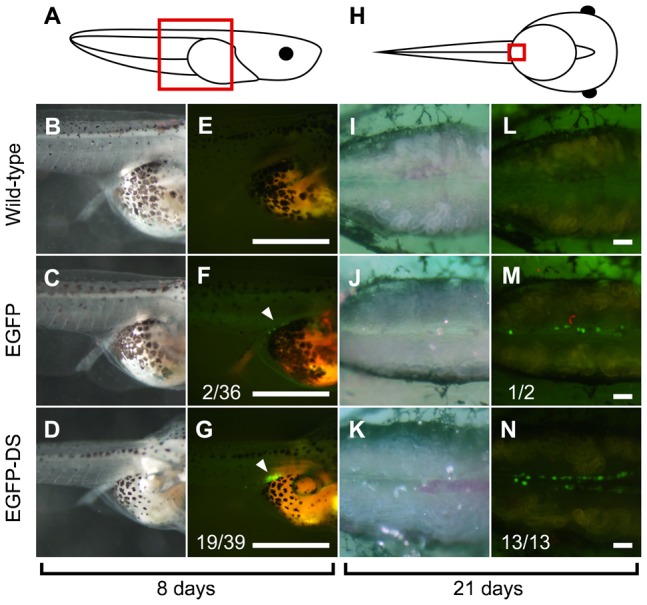
Fig. 1. Expression of EGFP in X. tropicalis tadpoles injected with EGFP-DS mRNA.

(A,H) A schematic representation of a lateral view of an 8-day-old tadpole (A) and a ventral view of a 21-day-old tadpole (H). (B–G) Higher-magnification view of A. (I–N) Higher-magnification view of H. (B,E,I,L) Images of wild-type tadpoles. (C,F,J,M) Images of tadpoles injected with EGFP mRNA. (D,G,K,N) Images of tadpoles injected with EGFP-DS mRNA. (B–D) Brightfield images of live 8-day-old tadpoles. (E–G) EGFP expression in B, C and D, respectively. (I–K) Brightfield images of the mesonephros of 21-day-old tadpoles. (L–N) EGFP expression in I,J and K, respectively. F and G show the ratio of the number of EGFP-positive tadpoles on the eighth day to the number of mRNA-injected tadpoles. M and N show the ratio of the number of EGFP-positive tadpoles on the 21st day to the number of EGFP-positive tadpoles on the eighth day. The white arrowheads indicate PGCs. Scale bars = 1 mm in (E–G) and 0.1 mm in (L–N).
