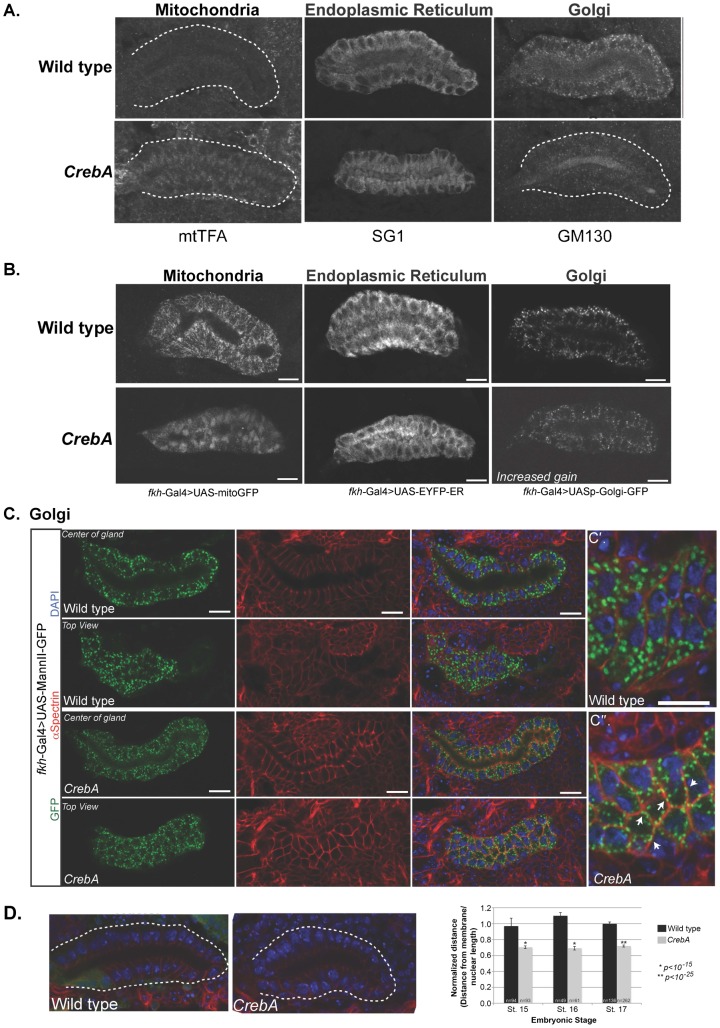
Fig. 1. CrebA mutant salivary glands (SGs) display altered organelle localization.
(A) Stage 15 embryos were fixed and stained with antibodies recognizing the mitochondria (mtTFA), endoplasmic reticulum (SG1) and Golgi (GM130). Note changes in localization of the mtTFA and SG1 staining intensity as well as reduced Golgi staining in the CrebA mutants SGs. White dashed lines outline the SG. (B) Fkh-Gal4 driving expression of mitochondrial (left panels), ER (middle panels) and Golgi (right panels) markers was examined in stage 15 WT (top panels) and CrebA mutant (bottom panels) SGs. (C) UAS-MannII-GFP (green) labels the Golgi stacks, which are distributed throughout the SG cells in both WT and CrebA mutants (left panels). α–Spec labels the lateral membranes (red in panels in right three columns) and DAPI labels the nuclei (blue in panels in right two columns). Confocal z-stack reveals that in wild-type SGs, the Golgi stacks are largely dispersed in the cytoplasm (C′). In CrebA mutants, the stacks are smaller and often found near the membrane (white arrows), as revealed by co-staining with α–Spec (C″). (D) Staining with α–Spec (red) and DAPI (blue) reveals that the nuclei are located closer to the basal surface in CrebA mutants. The white dotted line outlines the gland and GFP (green) labels the balancer chromosome marker used to identify heterozygous animals. Measurements of nuclear position in WT and CrebA mutant SGs (distance from the basal membrane to center of nucleus, divided by nuclear length) revealed a significant decrease in the distance from the basal membrane to the nuclei in CrebA mutants at embryonic stages 15–17. p-values were determined using a two-tailed Student's t-test. Error bars represent standard deviation. Scale bars: 10 µm.

