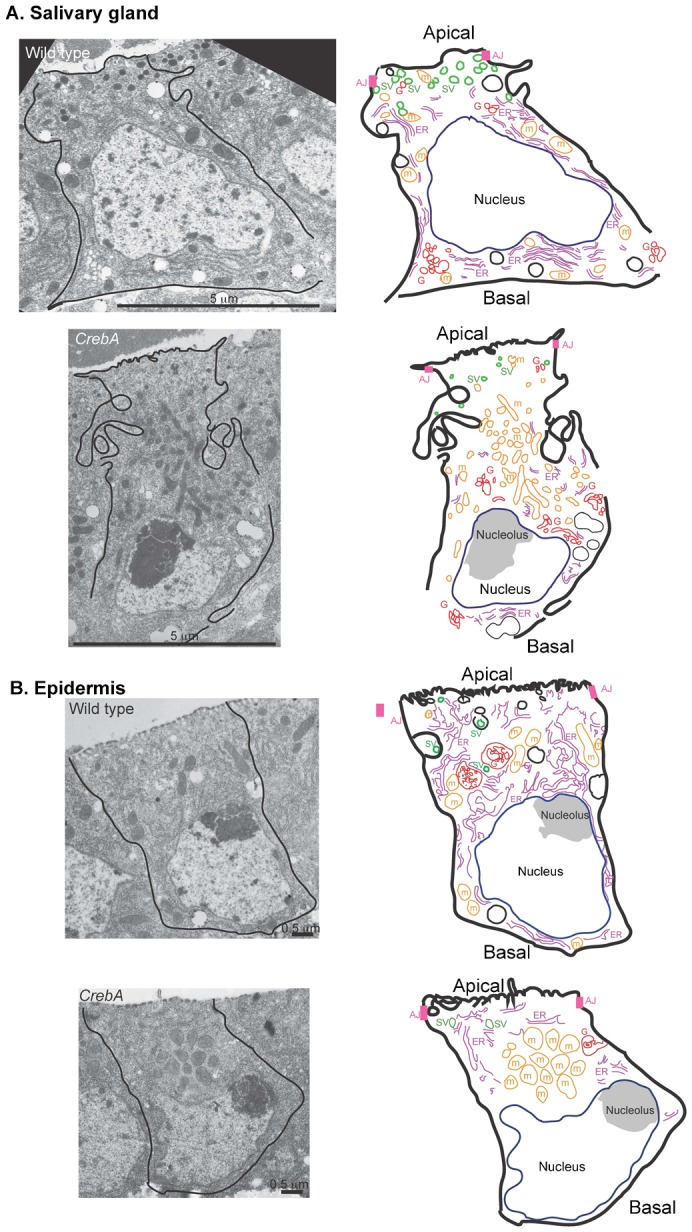
Fig. 4. TEM analysis reveals changes in organelle positioning in both the SG and epidermis.

(A) TEM images of single WT and CrebA mutant salivary gland cells (left), with cartoon drawings to the right that show the organization of the organelles in the micrograph of a single stage 16 wild type salivary gland cell to the left. (B) TEM images of single WT and CrebA mutant epidermal cells (left) with cartoon drawings to the right that show changes in organelle localization observed in a CrebA epidermal cell to the left. Scale bars: 5 µm (A); 0.5 µm (B).
