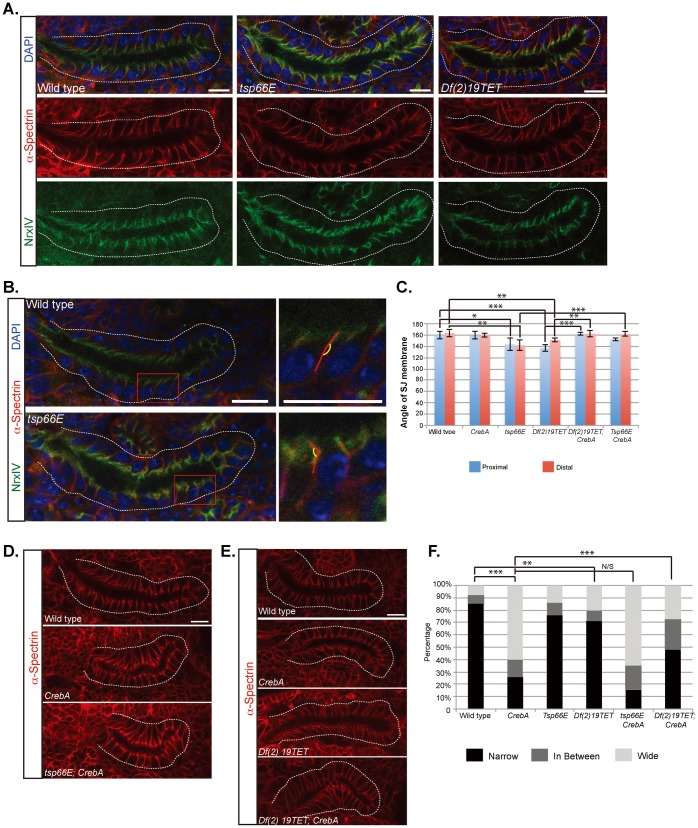
Fig. 7. Tetraspanin loss results in irregularities in the SJ region of the membrane that are rescued by simultaneous loss of CrebA.
(A) α–Spec (lateral membrane marker, red) and NrxIV (septate junction marker, green) staining reveal that tsp66E mutant and Df(2)19TET SGs show some “swaying” in the region of the SJ compared to the rest of the lateral membrane. Dashed line outlines the SGs. (B,C) Quantification of the angle between the SJ region and the remainder of the lateral membrane region reveals significantly more “sway” in the SJs of tsp66E and Df(2)19TET mutant SGs than in WT or CrebA mutants. Ten SJs at both the proximal (blue) and the distal (red) regions of ten individual SGs were analyzed (100 total SJs per genotype). Red boxes outline region magnified to the right. (D) α–Spec staining of wild type, CrebA and tsp66E CrebA mutant SGs. (E) α–Spec staining of wild type, CrebA, Df(2)19TET, and Df(2)19TET; CrebA mutant SGs. (F) At least 70 SJs from 3 individual glands of each genotype were classified as Narrow, wide or in between based on α-Spec staining. All SGs are embryonic stage 16. Error bars represent standard deviation. p-values were determined using the students t-test (C) or the g-test (F). * denotes p<0.1, ** denotes p<0.05, *** denotes p<0.01. Scale bars: 10 µm.

