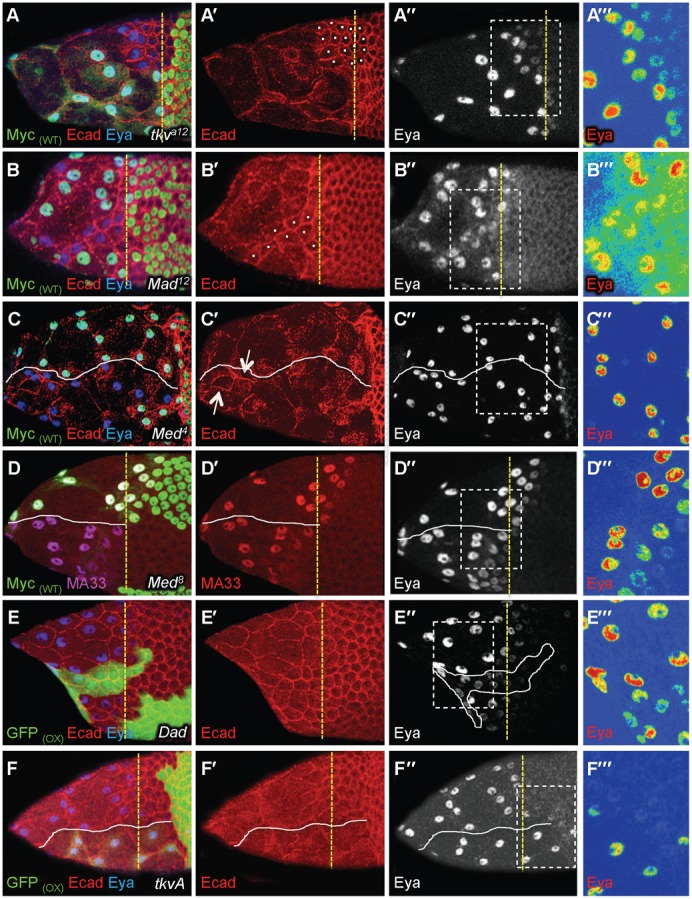
Fig. 3. TGFβ is required for cuboidal-to-squamous transition.

In all figures, the yellow dotted line marks the A/P position of WT flattening StC and the white line separate the mutant cells from WT cells; the Myc(WT) and GFP(WT) labels indicate that WT cells are green whereas the GFP(OX) label indicates that cells overexpressing a transgene are green; the use of a colour gradient allows the visualization of differences in intensities of protein accumulation from none (blue) to strongest (red); A‴–F‴ are magnified views of the boxes drawn in A″–F″. (A–F‴) Stage 9 (A,B,D–F) or 10 (C) follicles with clones of mutant cells (A–D) or with clones of cells over-expressing Dad (E) or tkvA (F). A‴–F‴ are magnified views of the boxes drawn in A″–F″. (A,B) Difference of dynamic of AJ remodelling between WT StC and mutant StC (white dot) in round or drawn-out clones. Mutant StC undergoing flattening were located three to four rows anterior to WT StC. (C) Follicle with Med clones. The arrows point to persistent AJ within clones. (D) Comparison of MA33 expression between Med and WT StC. (E) Difference of AJ remodelling dynamic between Dad and WT StC (n = 59). (F) Difference of dynamic of the flattening between tkvA and WT StC. In (C–F) a white line separates mutant, Dad or tkvA StC or from WT StC. All the phenotypes have been observed with different alleles of tkv, punt, Mad and Med: for tkv (tkva12: n = 50; tkv8: n = 88, tkv7: n = 42); for punt (puntΔ61: n = 30; punt135: n = 20; punt1046: n = 18), for Mad (Mad1-2: n = 90, Mad12: n = 40, Mad8-2: n = 35), and for Med (Med8: n = 210; Med13: n = 123, Med4: n = 134).
