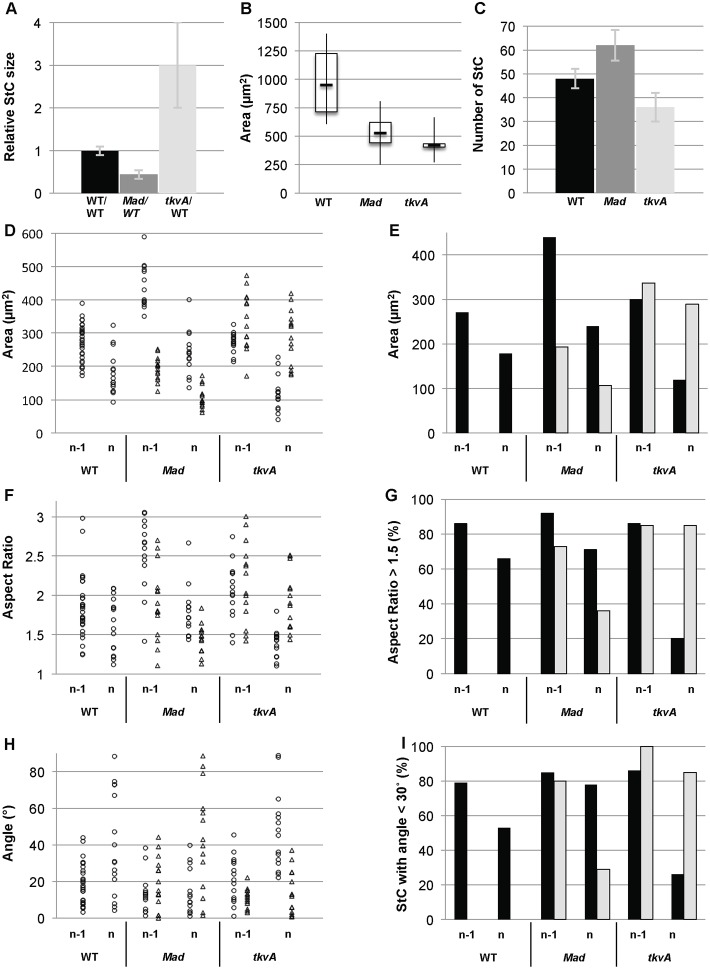
Fig. 4. TGFβ controls the timing, the degree and the dynamic of StC flattening.
Mad follicles refer to follicles containing 40 to 60% of Mad12 or Mad1-2 StC. Note that no measurement has been done on follicles containing 100% of mutant StC, as such follicles die prematurely. tkvA follicles refer to follicles containing more than 50% (A,D–I) or 80% (B,C) of tkvA StC. (A) Relative size of WT, Mad or tkvA StC during flattening. Ratios have been calculated by measuring Area of WT, Mad or tkvA StC located in the same row than WT flattening StC in WT, Mad or tkvA follicles, respectively. Each sample represents at least 28 cells from stage 9 follicles (n = 5) (0.3<lo/lf>0.35). (B) Box and whisker plots of apical surface area (Area) from WT, Mad and tkvA follicles. Each sample represents at least 35 cells from stage 10 follicles (n = 10) (lo/lf = 0,5). (C) Determination of the number of StC in WT (n = 10), Mad (n = 18) or tkvA (n = 22) follicles (lo/lf = 0.5). (D,F,H) Apical surface area (Area), shape (Aspect Ratio) or direction of the cell elongation (Angle) of individual StC is plotted in function of the row: flattening (row n) and flattened (row n-1); and of the genotype: WT (dots), Mad (triangles) or tkvA (triangles). Each sample represents 9 to 14 cells from 4 to 5 follicles (lo/lf = 0.35). (E) Average of apical surface area (Area) of StC per row and genotype: WT (black bar), Mad (grey bar) or tkvA (grey bar). (G) Percentage of StC displaying an Aspect Ratio superior of 1.5, per row and genotype. (I) Percentage of StC elongated in a direction making an angle superior of 30° with the A/P axis, per row and genotype. (E,G,I) Each sample represents 15 to 30 cells from 10 follicles.

