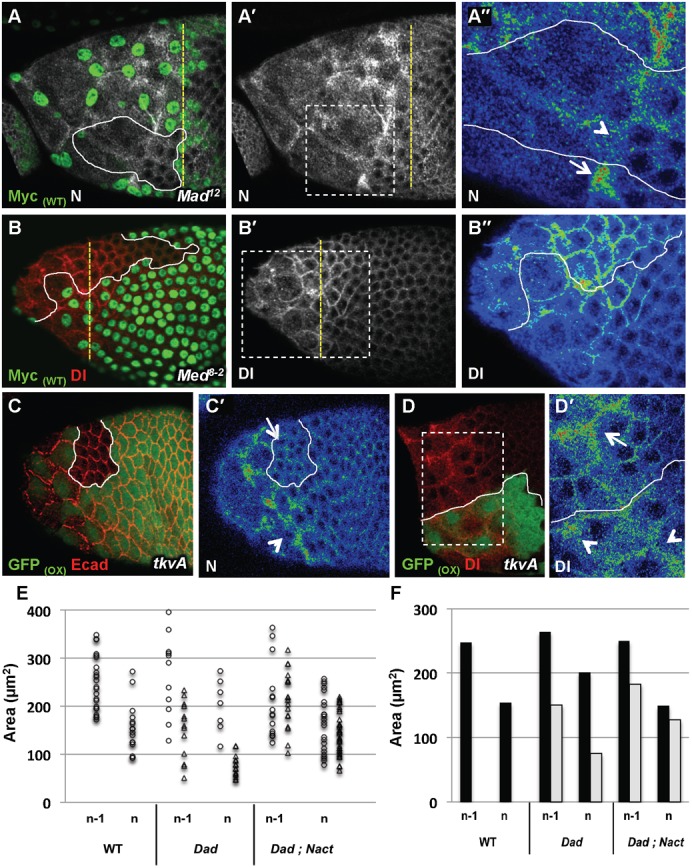
Fig. 5. TGFβ controls N and Dl expression patterns.

(A–B″) Stage 9 follicles with clones of Mad or Med cells (A B). A″,B″,D′ are magnified views of the boxes drawn in A′,B′ and D. (A) N expression at AJ undergoing remodelling in Mad (arrowhead) or WT StC (arrow) (n = 10 for Mad and n = 8 for Med). (B) Dl expression in Mad or in WT StC. (n = 8 for Mad and n = 7 for Med) (C,D) Follicles with clones of cells over-expressing tkvA. (C,C′) N expression at the AJ undergoing remodelling of tkvA StC (arrowhead) or of WT cells (arrow) in a stage 8 follicle (n = 23). (D,D′) Dl expression in tkvA StC (arrowhead) or in WT StC (arrow) at stage 9 (n = 19). (E) Apical surface of area (Area) of individual StC is plotted in function of the row: flattening (row n) and flattened (row n-1); and of the genotype: WT (dots), UAS-Dad (triangles) or UAS-Dad; UAS-Nact (triangles). Each sample represents 9 to 14 cells from 3 to 5 follicles (lo/lf = 0.35). (F) Average of apical surface area (Area) of StC per row and genotype: WT (black bar), UAS-Dad (grey bar) or UAS-Dad; UAS-Nact (grey bar). Each sample represents 15 to 30 cells from 10 follicles.
