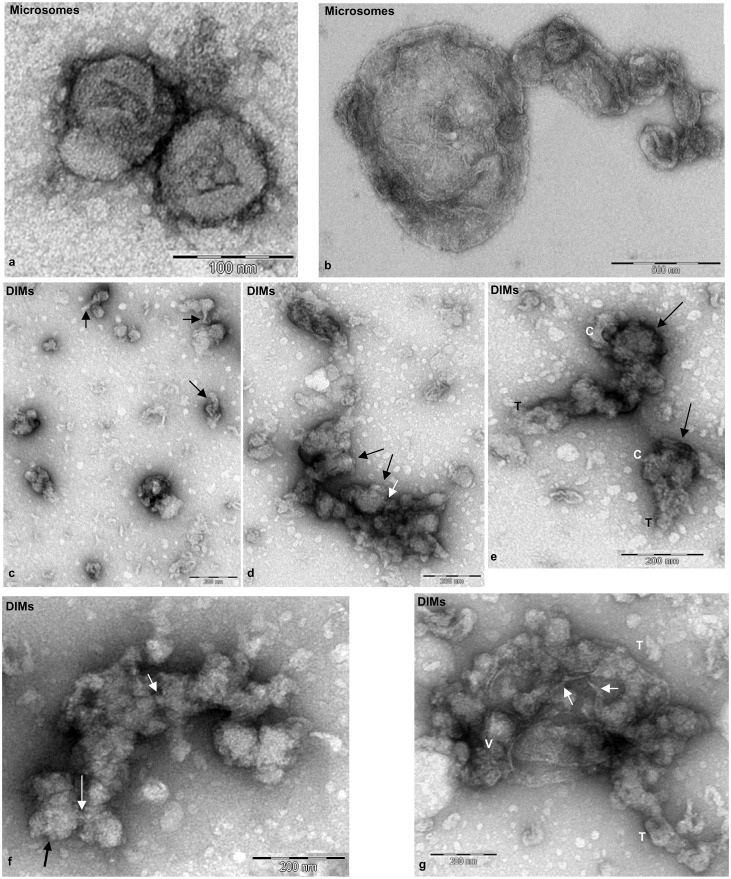
Fig. 2. Transmission electron microscopy of fresh microsomes and DIMs.
(a,b) P2 membranes appeared as regular vesicles having variable diameters ranging from 100 nm to 1 µm. (c–g) DIM membranes showed greater variability in size and shape than P2. Single vesicles (50–150 nm), with thin projections (c, arrows) alternate with vesicle clusters (d, arrows). Rounded cisternae (e,f, indicated as C) connected via tubular membranes (e, indicated as T; f, white arrows). Clusters of membranes comprising tubules (g, T) and clustered vesicles (V) connected by thin bridges (g, white arrows). Scale bars: 100 nm (a); 500 nm (b); 200 nm (c–g).

