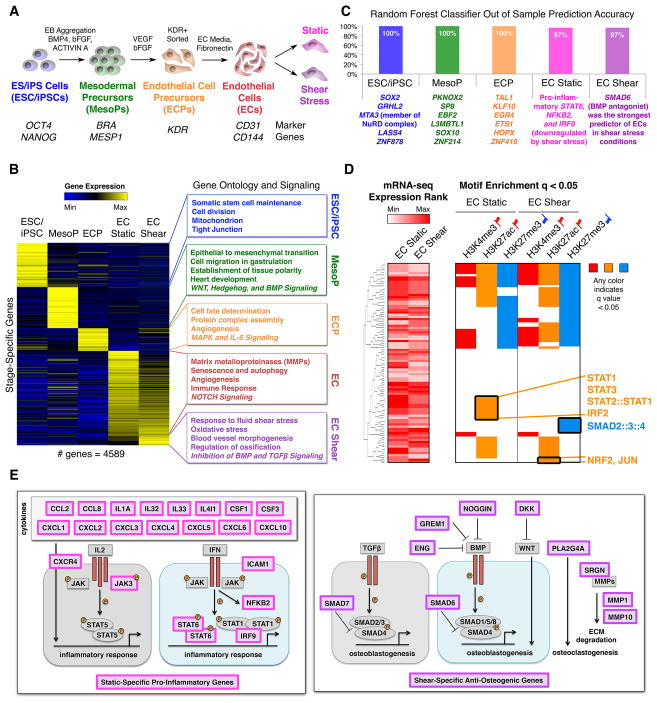
Figure 1. Transcriptional Mechanisms in EC Differentiation and Response to Shear Stress.
(A) Stages of EC differentiation analyzed.
(B) Unique signature of EC differentiation stages by RNA-seq. Stage-unique genes were expressed most highly at the given stage and significantly upregulated relative to immediately preceding or following stages. p < 0.05 by negative binomial test with false discovery rate (FDR) correction.
(C) Top stage-predictive TFs identified by random forest classifier.
(D) Left: Expression of TFs whose motifs were tested in the corresponding rows on the right. Right: Motif enrichment within activating or repressive chromatin marks in ECs exposed to static or shear stress conditions suggesting activated or repressed signaling pathways. Any color indicates significant motif enrichment (q < 0.05) by motif Diverge with FDR correction while white indicates non-significance. Red up flags: activating marks; blue down flags: repressive marks.
(E) Left: Diagram of static-specific pro-inflammatory genes (pink). Right: Diagram of shear-specific anti-osteogenic genes (violet).

