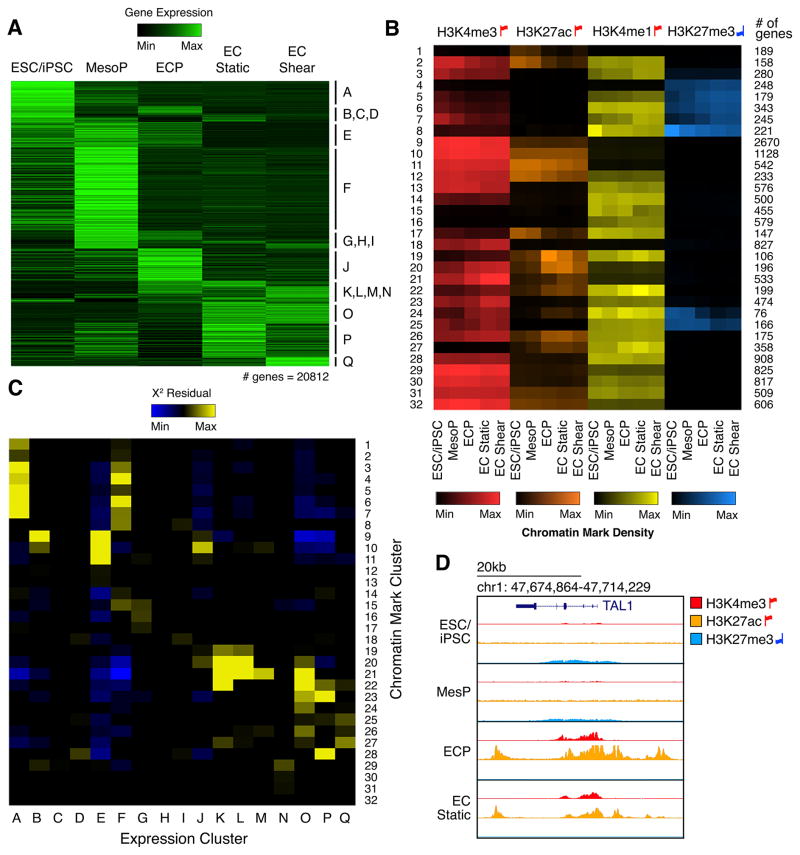
Figure 2. Correlation of Dynamic Chromatin Patterns with Transcriptional Transitions.
(A) Hierarchical clustering of mRNA expression.
(B) Hierarchical clustering of genes based on enrichment of histone modifications within 1 kb of the TSS. Color indicates mean enrichment for each gene cluster. Red up flags: activating marks; blue down flags: repressive marks.
(C) The overlap of genes within expression clusters (horizontal axis) and chromatin clusters (vertical axis). Color represents X2 residuals (any yellow indicates significant overlap between genes in the corresponding expression and chromatin cluster).
(D) Histone modification enrichment around TAL1 (Cluster J) during EC differentiation.

