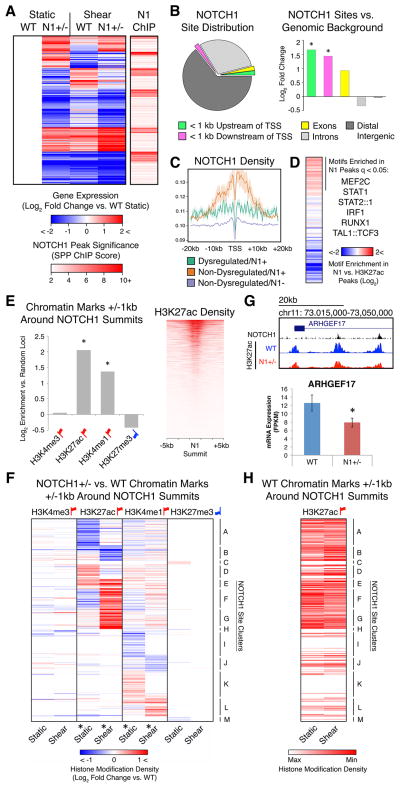
Figure 5. Transcriptional and Epigenetic Dysregulation Directly Associated with N1 Genome Occupancy.
(A) Left: K means clustering of putative direct N1 targets defined as genes significantly dysregulated in N1+/− ECs with N1 ChIP peaks within 20 kb of the TSS. Right: Significance of N1 peaks within 20 kb of the TSS of 414 putative direct N1 targets.
(B) Left: Distribution of N1 peaks. Right: Log2 fold change of proportion of N1 peaks vs. genomic background in indicated regions. *p < 0.05 by X2 test with Bonferroni correction.
(C) N1 density around the TSS of genes dysregulated in N1 haploinsufficiency with N1 peaks within 20 kb (green), non-dysregulated genes with N1 peaks within 20 kb (orange), or non-dysregulated genes without N1 peaks within 20 kb (blue).
(D) Motifs significantly enriched (q < 0.05 by motif Diverge with FDR correction) within 25 bps of N1 peak summits compared to H3K27ac peaks in ECs in static conditions.
(E) Left: Log2 fold change of overlap of chromatin marks in WT ECs with 1 kb around N1 summits vs. random non-gap genomic loci. *p < 0.05 by X2 test with Bonferroni correction. Right: H3K27ac density near N1 summits.
(F) Hierarchical clustering based on log2 fold change of N1+/− vs. WT histone modification density within 1 kb of N1 summits. *p < 0.05 by KS test with Bonferroni correction (histone modification dysregulation around N1 summits vs. random non-gap genomic loci).
(G) Top: N1 peaks and WT or N1+/− H3K27ac near ARHGEF17. Bottom: Mean mRNA expression of ARHGEF17. Error bars represent standard error; *p < 0.05 by negative binomial test with FDR correction.
(H) Relative H3K27ac density within 1 kb of N1 summits ordered as in (F) in WT ECs in static or shear stress conditions.
In (A–H): Gene expression: WT n = 3, N1+/− n = 2 (isogenic iPSC-derived ECs). Chromatin marks: WT n = 5, N1+/− n = 3 (patient-specific iPSC-derived ECs). N1 genome occupancy: WT n = 1 (union of 3 technical replicates) (primary HAECs). Red up flags: activating marks; blue down flags: repressive marks. See also Figure S6.

