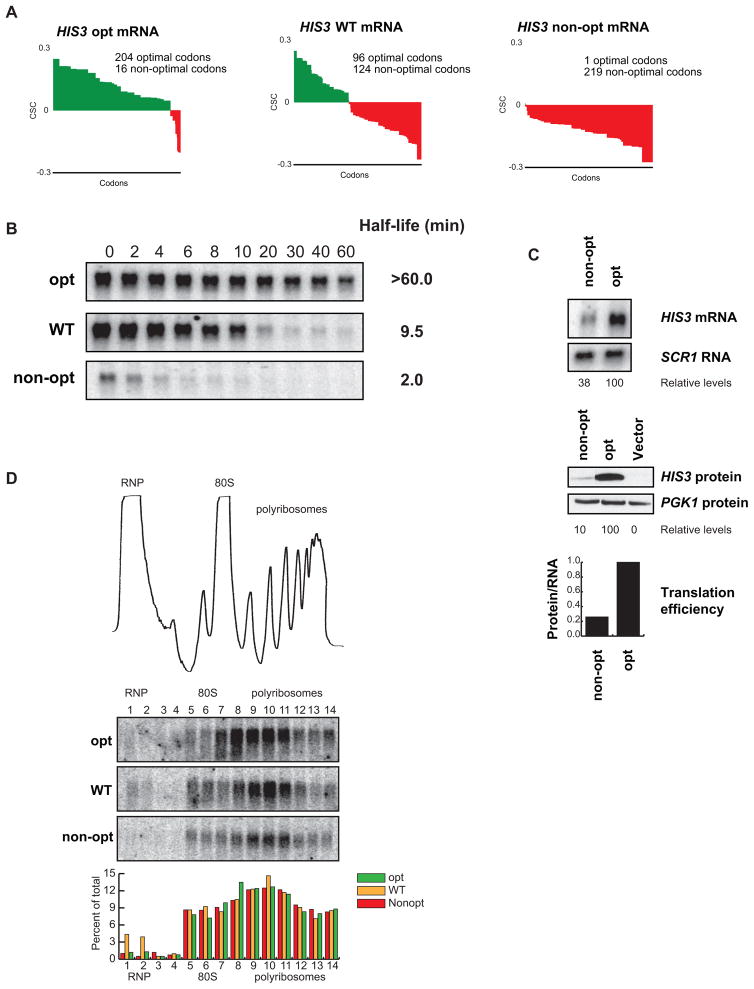
Figure 5. Optimality can affect translation and stability of an mRNA without changes in ribosome association.
(A) Codon optimality diagram of HIS3, a transcript with an intermediate half-life, as well as versions engineered with synonymous substitutions to contain higher and lower percent optimal codons, HIS3 opt and HIS3 non-opt respectively. (B) Northern blots of rpb1-1 shut-off experiments are shown with half-lives of all three messages. Quantitation is normalized to SCR1 loading controls not shown. (C) Northern and western blots for steady state concentrations of the optimal and non-optimal versions of HIS3. Loading controls and quantitation are shown below. Translational efficiency is calculated as relative protein levels divided by relative mRNA levels and plotted at the bottom. (D) A trace of sucrose density gradient analysis, along with northern blot analysis of the gradient fractions. The blots show location of the three HIS3 reporters within the gradient. Quantitation for each fraction is shown below.

