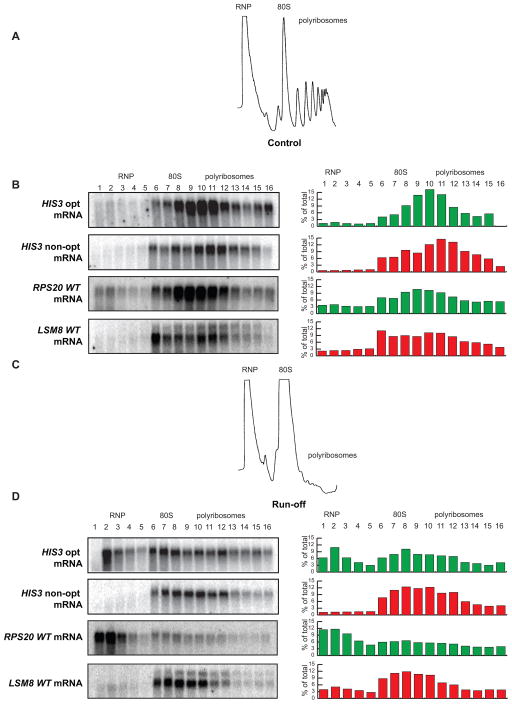
Figure 6. Optimal and non-optimal transcripts are retained differently on polysomes.
(A) Representative A260 trace of sucrose density gradient analysis demonstrating normal distribution into RNP, 80S, and polyribosome fractions. (B) Distribution of the optimal and non-optimal HIS3 reporters and the RPS20 and LSM8 mRNAs in the sucrose density gradients under normal conditions showing localization primarily in the polyribosome fractions. (C) Representative A260 trace of sucrose density gradient analysis under run-off conditions, showing collapse of the polyribosome fractions. (D) Distribution of the optimal and non-optimal HIS3 reporters and the RPS20 and LSM8 mRNAs under run-off conditions, demonstrating differential relocation.

