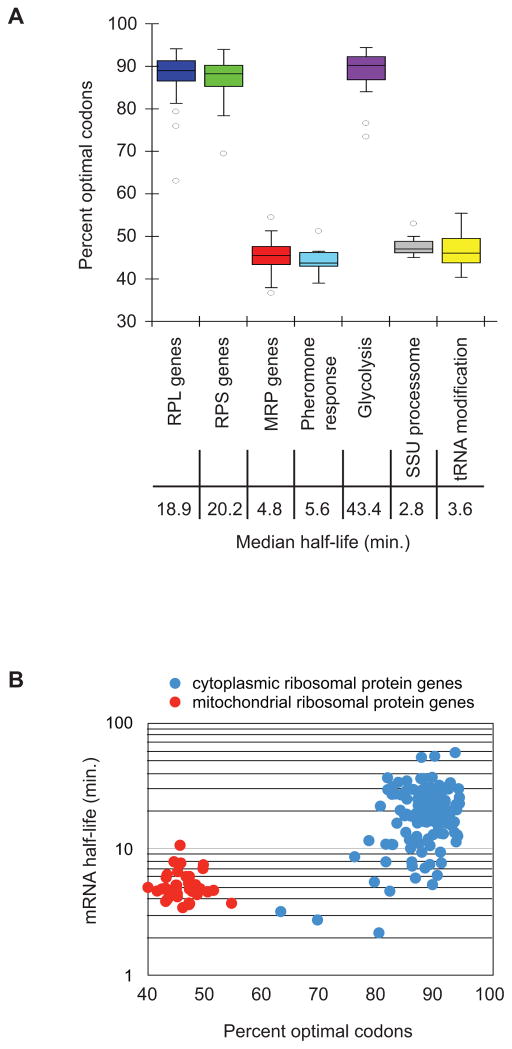
Figure 7. Functionally related genes display similar optimality.
(A) Groups of genes whose protein products have related functions are plotted to show their optimality. Half of the data fall within the boxed section, with the whiskers representing the rest of the data. Data points falling further than 1.5 fold the interquartile distance are considered outliers. Represented gene groups are: 70 RPL (large ribosomal subunit proteins) genes, 54 RPS (small ribosomal subunit proteins) genes, 42 MRP (mitochondrial ribosomal proteins) genes, 14 pheromone response genes, 10 glycolysis enzymes, 15 SSU (small subunit processosome) genes, 12 tRNA processing genes. (B) Breakdown of two groups to show relationship between optimal codon content and half-life within the groups. mRNA half-life for each protein in the cytoplasmic ribosome and the mitochondrial ribosome is plotted against the optimal codon content of that mRNA.

