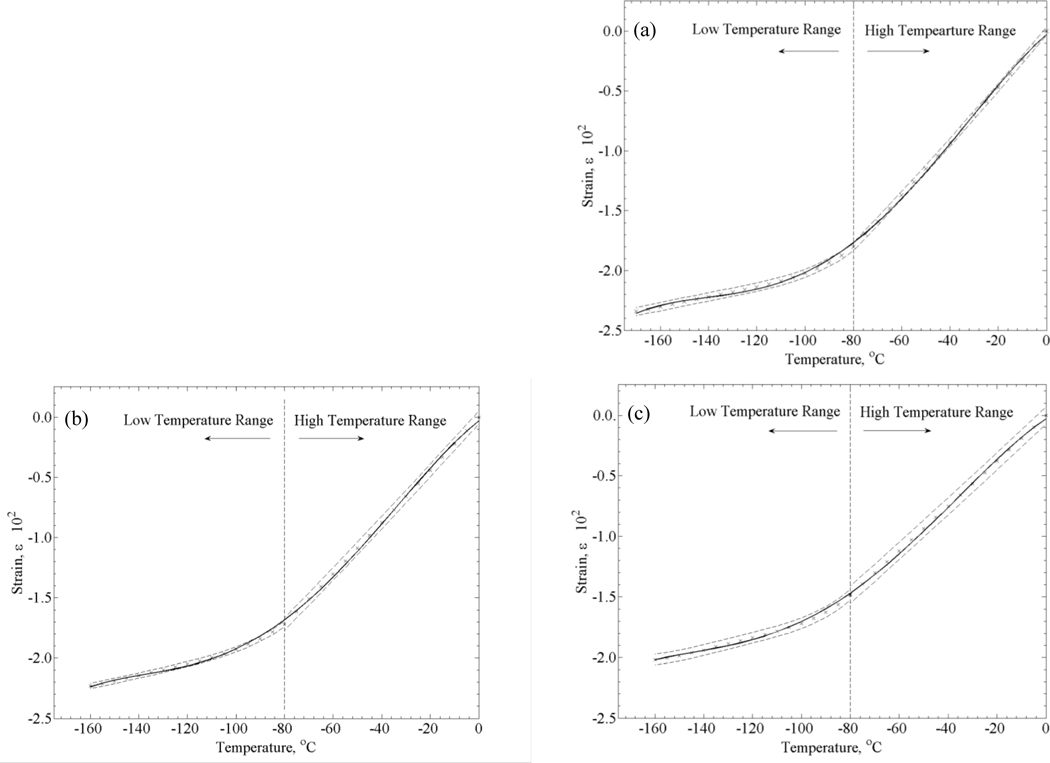
Figure 7.
Unified thermal-expansion curves including data from the upper [5] and lower [current study] parts of the cryogenic temperature range, for DP6 combined with (a) 12% PEG400, (b) 6% 1,3-CHD, and (c) 6% 2,3-BD. Symbols represent data points calculated from the polynomial approximation for each subset (Table 1), solid lines represent polynomial approximations of the unified thermal strain, and dashed lines represents the ±2σ range.

