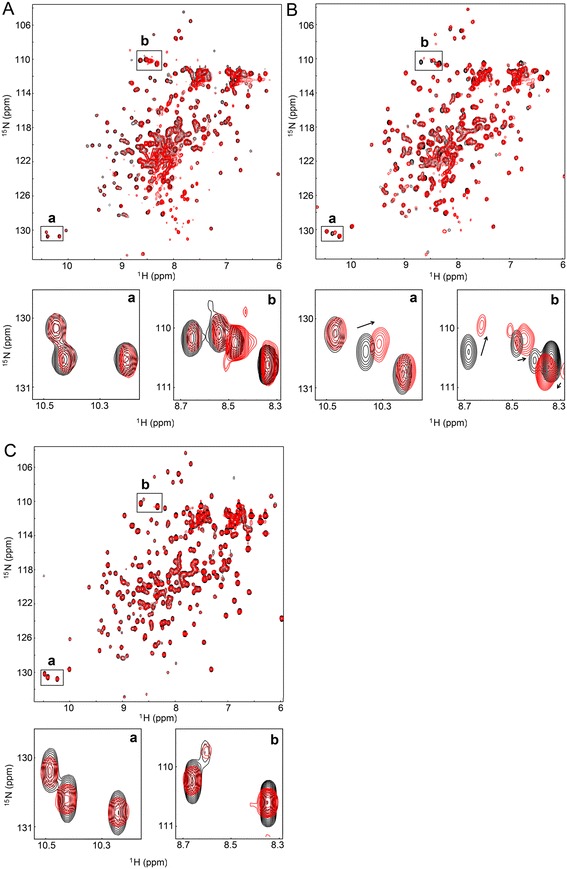
Figure 5.

HSQC spectra of RTshort-WT, RTshort- mt4 and RTshort- mt4 -T345S . Overlays of 1H/15N-HSQC spectra of RTshort proteins in the absence of ATP (black) and in the presence of 21 mM ATP (red) in binding buffer with 10% D2O at a sample temperature of 298 K. (A) black: 460 μM RTshort-WT without ATP; red: 363 μM RTshort-WT with a 58 fold ATP excess. (B) black: 550 μM RTshort-mt4 without ATP; red: 434 μM RTshort with a 48 fold ATP excess. (C) black: RTshort-mt4-T345S without ATP; red: 355 μM RTshort-mt4-T345S with a 59 fold ATP excess
