Figure 4.
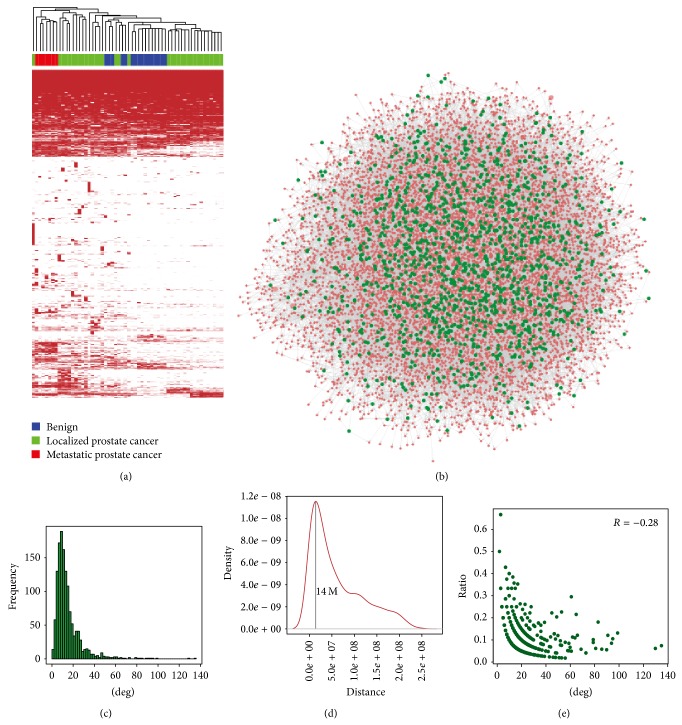
(a) A binary map showing the presence (red) and absence (white) of lncRNAs in 58 samples can distinguish prostate cancer samples from benign samples and differentiate localized prostate cancer samples from metastatic samples. (b) The regulatory network between lncRNAs and protein-coding genes was constructed using RNA-seq data of 58 prostate samples based on the Bayesian network method. Red nodes represent protein-coding genes, and green nodes represent lncRNAs. (c) Distribution of degree of lncRNAs in the regulatory network. (d) The distance between lncRNAs and their linked protein-coding genes. (e) The ratio of protein-coding genes located on the same chromosome with their linking lncRNAs.

