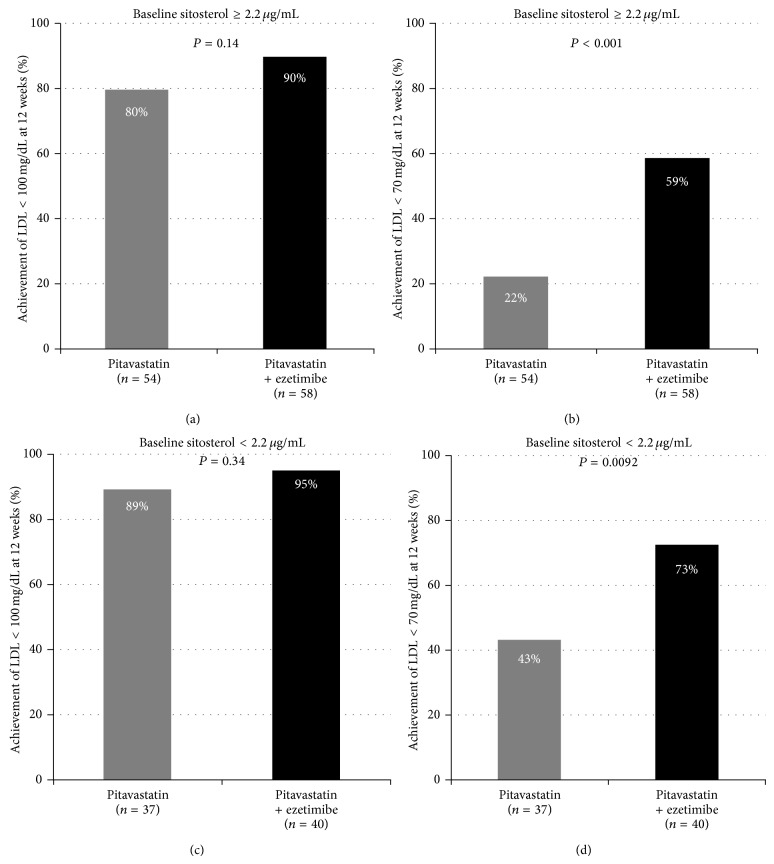
Figure 5.
The impacts of baseline levels of sitosterol and lipid-lowering treatment strategy. (a) The achievement rate of LDL-C less than 100 mg/dL and (b) less than 70 mg/dL (b) in each treatment group whose baseline sitosterol is equal to or more than 2.2 μg/mL. (c) The achievement rate of LDL-C less than 100 mg/dL and (d) less than 70 mg/dL in each treatment group whose baseline sitosterol is less than 2.2 μg/mL.

