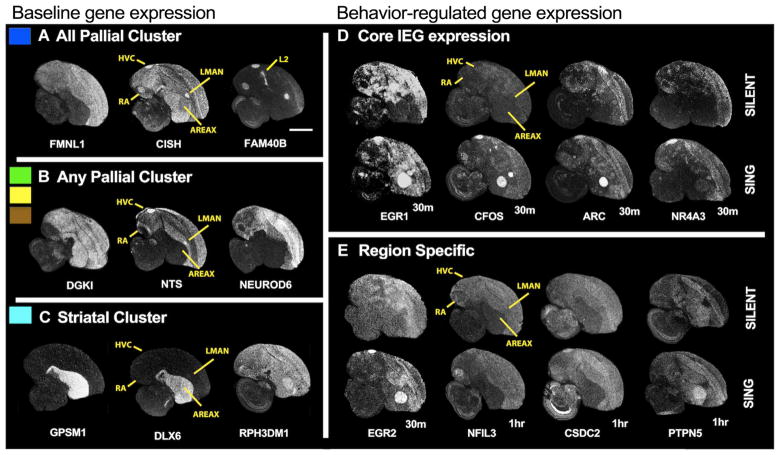
Fig. 3. In situ hybridizations of baseline and singing-regulated genes.
(A) Genes higher in all pallial song nuclei (RA, HVC, and LMAN) relative to the striatal song nucleus (Area X) at baseline (Fig. 2A, blue clusters). (B) Genes differentially expressed just among the pallial song nuclei (green, yellow, and brown clusters) at baseline. (C) Genes higher in the striatal song nucleus relative to pallial song nuclei (turquoise cluster). (D) Core singing-regulated genes regulated in three to four song nuclei detected by microarrays but detected in all four with diverse levels by in situ hybridization, most peaking at 30 min. (E) Region-enriched singing-regulated genes in one or two song nuclei, with peaks of expression at later time points. Film autoradiograph images are inverted, showing white as labeled mRNA expression of the gene indicated below the image. Dorsal is up; anterior is right. Scale bar, 2 mm.

