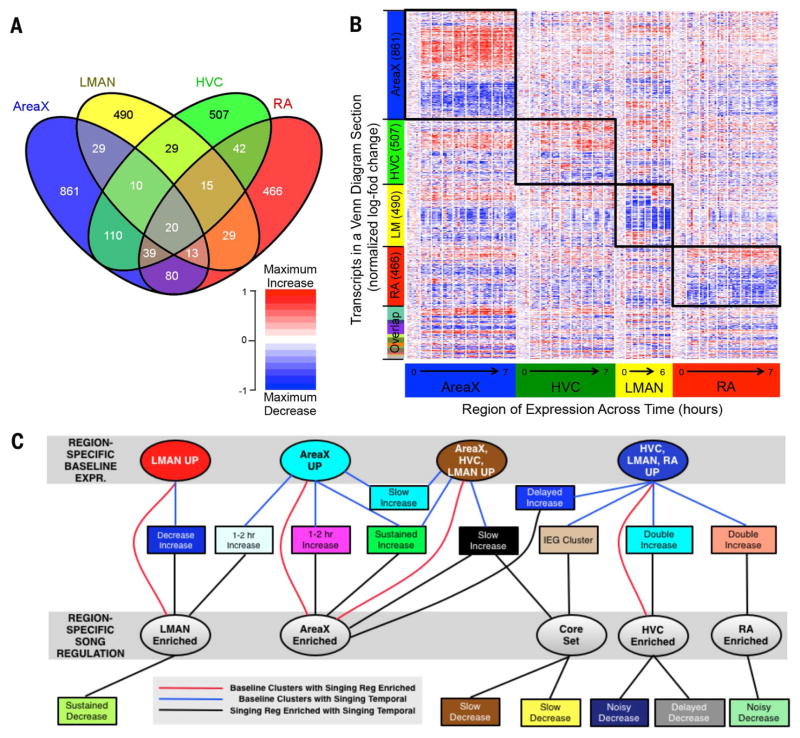
Fig. 4. Region-enriched gene expression in response to singing.
(A) A four-way Venn diagram showing regional singing-regulated distribution of 2740 transcripts (FDR q < 0.2). (B) Heat map of all 2740 transcripts from the Venn diagram, hierarchically clustered independently in all four song nuclei, then sorted by increased or decreased expression, and level of significance from highest to lowest in the linear model. Each column (170 total) is an animal replicate within a time point, and white lines separate time points. Red, increases; blue, decreases; white, no change relative to 0-hour samples for each song nucleus. Each transcript is normalized so that the maximum increase relative to nonsinging birds in any region is the darkest shade of red for increasing transcripts, and the maximum decrease is the darkest shade of blue for decreasing transcripts. Boxes highlight significant behaviorally regulated enrichment for each region (FDR q < 0.2 for that region). Figure S12 shows a more stringent heat map of region-enriched expression with a similar result. (C) Relationships among clusters of transcripts from the baseline region-enriched (top gray box, from Fig. 2A), singing temporal-enriched (rectangular nodes, from fig. S3, A to D), and singing region-enriched [bottom gray box, from (B)] patterns. Nodes are colored according to their cluster colors in the respective figures. Edges between two nodes correspond to significant overlap between two groups of transcripts (P < 0.001, hyper-geometric test). Nodes are sorted to optimize noncrossing of edges. Detailed results are in table S8.

