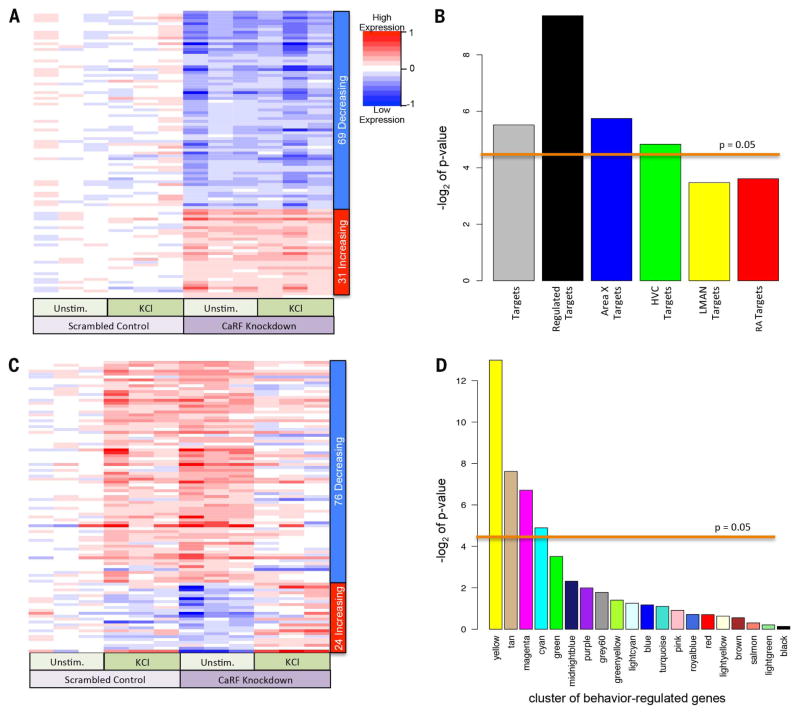
Fig. 7. RNAi knockdown illuminates CaRF binding motif relationships with singing-regulated genes.
(A) Heat map of genes affected by CaRF knockdown independent of membrane depolarization in mouse cultured neurons. Rows represent the 100 transcripts most changed by CaRF RNAi knockdown (P < 0.0014; FDR q < 0.475), sorted according to the t statistic, which takes direction of regulation into account. Each column is an independent sample (n = 3 unstimulated controls; n = 3 KCl depolarized in the presence of either scrambled RNAi or CaRF RNAi knockdown virus). Color intensities (blue to red) represent the log fold change in knockdown cells relative to the mean of the scrambled control conditions. (B) Significance of the enrichment of zebra finch baseline genes (cluster colors according to Fig. 2A) with CaRF promoter motifs in the ranked list of t values for CaRF knockdown–affected genes in mouse cultured neurons. P < 0.05 (above line) is a significant association, Wilcox rank sum statistic over multiple permutations (66). (C) Similar to (A), except for genes that respond differently to KCl activity in the CaRF knockdown cells. Rows represent the 100 transcripts most changed in expression (P < 0.015, factorial test), sorted according to the t statistic. (D) Significance of the enrichment of zebra finch singing-regulated genes (cluster colors according to Fig. 5 and fig. S3), with CaRF promoter motifs in the ranked list of t values for genes differentially regulated by neural activity in mouse cortical neurons during CaRF knockdown versus control. P < 0.05 (above line) is a significant association, Wilcox rank sum statistic over multiple permutations (66).

