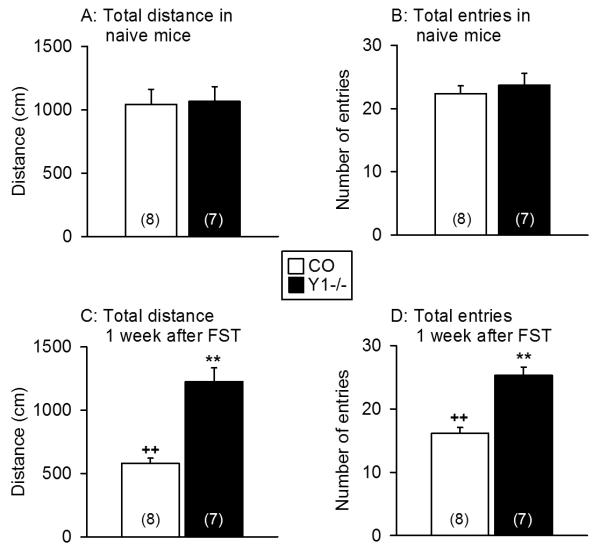
Figure 1.
Locomotor behaviour on the EPM as measured in naïve control and Y1−/− mice and in mice that had been exposed to the FST one week before the EPM test. The graphs show the total distance traveled in the open and closed arms (A,C) and the total number of entries into any arm (B,D) during the 5 min test session. The values represent means ± SEM, n as indicated in parenthesis. ** P < 0.01 versus control mice under the same experimental conditions, ++ P < 0.01 versus naïve mice of the same genotype.

