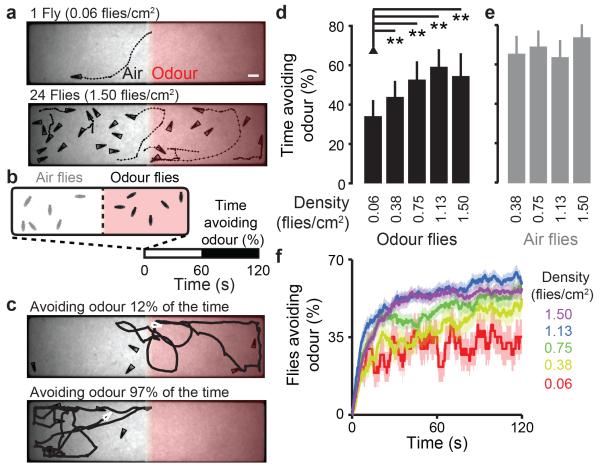
Figure 1. Collective odour avoidance in Drosophila.
a, Image of flies (triangles) and their trajectories (dashed lines) during 2 s in a two-choice olfactory assay. 5% CO2 (‘Odour’) flows through the right half while air flows through the left half. Two densities of flies are shown (0.06 & 1.50 flies/cm2). The scale bar is 2.5 mm. b, Schematic of the odour avoidance experiment. Flies in the odour zone at stimulus onset (t = 0) are measured for the time spent in the non-odour zone during the second minute of the experiment (‘Time avoiding odour (%)’). c, Flies (white triangles) with a low (top) or high (bottom) percent time avoiding odour. d-e, The percent time avoiding the odour (mean and s.d.) for five different densities of flies starting in the odour zone (black bars) (d) and four densities of flies starting in the air zone (grey bars). N = 37, 38, 36, 35, and 38 experiments for 0.06, 0.38, 0.75, 1.13, and 1.5 flies/cm2 respectively. (e). In this and all subsequent figures, unless otherwise stated, a single asterisk (*) denotes P <0.05 and a double asterisk (**) denotes P <0.01 for a Bonferroni-corrected paired sample t-test (bar plot comparisons) or a Mann-Whitney U-test (boxplot comparisons). f, The proportion of flies outside of the odour zone over the entire experiment. The mean (solid line) and s.e.m. (transparency) are colour-coded for each density (n is as for panels d-e).

