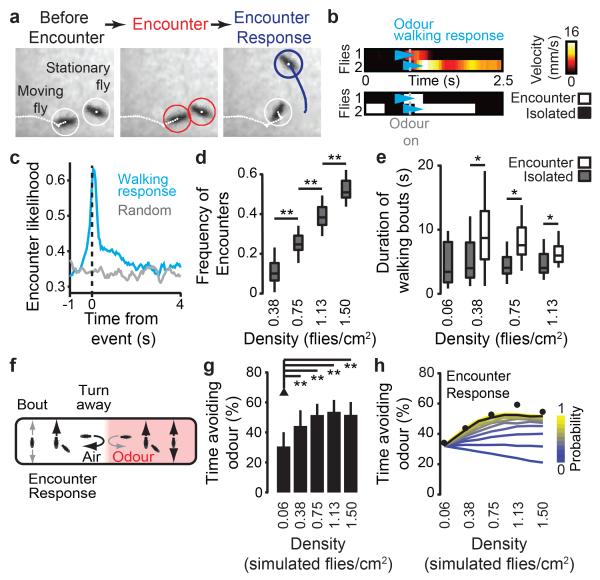
Figure 2. Inter-fly Encounters coincide with odour responses and are required for collective odour avoidance in simulations.
a, Images of two flies (left, white circles) undergoing an Encounter (middle, red circles) that results in an Encounter Response (right, blue circle). b, Velocities and Encounters for two flies exposed to CO2 at the odour onset (grey dashed line). The top panel shows the velocity for each fly. Cyan arrowheads indicate the first walking bout initiated after odour onset (‘Odour walking response’). The bottom panel shows when these flies are (white) or are not (black) undergoing an Encounter during the same time period. c, The likelihood of an Encounter with respect to the time of the odour walking response (blue line) or a randomly chosen time point (grey line). Data is from Fig. 1d: density = 1.13 flies/cm2 and n = 200 flies. d, The frequency of Encounters as a function of group density. Data is from Fig. 1d. e, The duration of walking bouts depending on whether they are initiated in isolation (grey boxes) or during an Encounter (white boxes). Data is from Fig. 1d. f, Simulated flies moved through a virtual arena as a function of three parameters: spontaneous bout probability (‘Bout’), Encounter Response probability (‘Encounter Response’), and turn away probability from the air-odour interface (‘Turn away’). Low (small grey arrows) or high (large black arrows) probabilities were experimentally determined (Extended Data Fig. 2). g, The percent time avoiding the odour (mean and s.d.) for five densities of simulated flies (n = 80 experiments for each condition). h, The sensitivity of simulated odour avoidance to Encounter Response probabilities ranging from 0 (never responding to Encounters, blue) to 1 (always responding, yellow). Each coloured line indicates the mean odour avoidance time. The black line indicates Probability = 0.8, taken from real fly data in Fig. 1 (n = 10,902 experiments for each data point). Black circles indicate the mean fly avoidance times from Fig. 1d.

