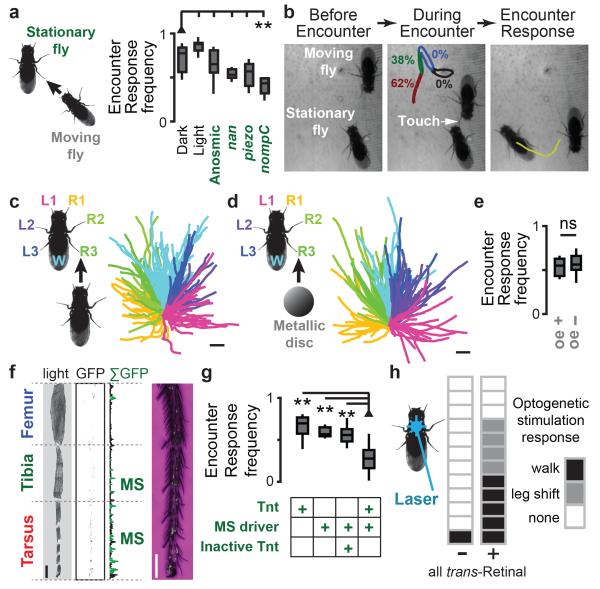
Figure 3. Leg mechanosensory sensilla neuron activity is necessary and sufficient for Encounter Responses.
a, The frequency of Encounter Responses measured from experiments in Figure 1 (‘Dark’), illuminated experiments (‘Light’), near-anosmic mutants (IR8a1;IR25a2;GR63a1,ORCO1), auditory/proprioceptive mutants (nanchung36a), nociceptive touch mutants (piezoKO), and gentle touch mutants (nompCf00914). To calculate the Frequency of Encounter Responses, we tested how often each stationary fly undergoing an Encounter moved continuously for the next half-second. N = 10 experiments for each condition (density = 0.75 flies/cm2). Reductions for nanchung and piezo mutants were not statistically significant (Extended Data Table 1). b, Single frames from a high-resolution video of an Encounter between a moving fly and a stationary fly. The schematic on the middle frame shows the percent of all observed Encounter Responses resulting from touch for each leg segment (n = 104 experiments). The Encounter Response walking trajectory elicited by touch is shown in yellow on the right-hand frame. c, Encounter Response trajectories (right) colour-coded by the appendage touched by the neighbouring fly (left). Wings (W, n = 54 experiments), Legs (R1-R3 and L1-L3, n = 21, 18, 19 and 23, 15, 17 experiments, respectively). The scale bar is 1 mm and each trajectory represents up to 0.24 s of walking. d, Touch response trajectories (right) colour-coded by which appendage was touched by a metallic disc (left). Wings (W, n = 20 experiments), Legs (R1-R3 and L1-L3, n = 20, 21, 21 and 18, 21, 20 experiments, respectively). The scale bar is 2.5 mm and each trajectory represents up to 1.5 s of walking. e, The frequency of Encounter Responses elicited by moving flies with (‘oe+’) or without (‘oe−’) cuticular hydrocarbon-secreting oenocytes (n = 11 experiments each). f, A transmitted light image, inverted fluorescence image (fluorescence in black), and summed fluorescence for a Mechanosensory Sensilla driver fly leg expressing GFP. Leg mechanosensory sensilla (‘MS’) are indicated in green. A high-resolution image of the tarsus is shown on the right. Endogenous GFP fluorescence (green) is superimposed upon a transmitted light image (magenta). The scale bars are 100 μm. g, The frequency of Encounter Responses for parental line controls (UAS-Tnt/+;+ or piezo-Gal4/+;cha3-Gal80/+), Mechanosensory Sensilla driver flies expressing an inactive tetanus toxin control (UAS-TntIMP/piezo-Gal4;cha3-Gal80/+), or Mechanosensory Sensilla driver flies expressing tetanus toxin (UAS-Tnt/piezo-Gal4;cha3-Gal80/+). N = 12, 13, 15, and 15 experiments, respectively. h, Blue laser optogenetic stimulation responses of flies expressing ChR2 in mechanosensory sensilla (piezo-Gal4/+; cha3-Gal80/UAS-ChR2(T159C)) in the absence (left) or presence (right) of the essential cofactor all trans-Retinal (n = 12 flies for each condition). Each box indicates the response for a single fly (‘walk’, ‘leg shift’, or ‘none’).

