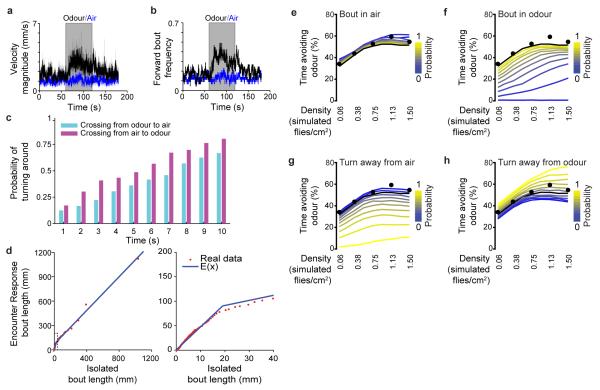
Extended Data Figure 2. Model parameter determination and the sensitivity of simulated collective behaviour to parameter variation.
a-b, Individual freely walking flies were presented with 5% CO2 (‘odour’) or air across the entire arena for 1 min. Mean (solid line) and s.e.m. (translucent shading) walking velocity magnitude (a) and forward bout probability (b) before, during, and after an odour impulse (black, n = 45 flies) or an air impulse control (blue, n = 43 flies). Bouts began when velocity exceeded a high threshold of 1 mm/s. Bouts ended when velocity dipped below a low threshold of 0.5 mm/s. Short bouts or pauses (<2 frames or 100 ms) were removed by merging the fly’s current behavioural state with neighbouring measurements. Grey indicates the period of odour presentation. c, Probability for Drosophila to turn back when crossing the interface from odour to air and vice versa after a given period of time. Data is from Fig. 1d (density = 0.06). d, Scatter plots of Drosophila bout lengths during isolation versus Encounter Response bout lengths (red dots) and the double-linear function fitting the data (blue line). N = 16 experiments at density = 0.38 flies/cm2. The graph on the right is a zoom-in of that on the left (dashed box). e-h, Sensitivity of simulated collective behaviour to P(boutair) ranging from Probability = 0 (blue, never initiating spontaneous walking in air) to Probability = 1 (yellow, always initiating spontaneous walking in air) (e), P(boutodour) ranging from Probability = 0 (blue, never initiating spontaneous walking in odour) to Probability = 1 (yellow, always initiating spontaneous walking in odour) (f), P(turn around from air) ranging from Probability = 0 (never turning around from the air zone, blue) to Probability = 1 (always turning around from the air zone, yellow) (g), P(turn away from odour) ranging from Probability = 0 (never turning around from the odour zone, blue) to Probability = 1 (always turning around from the odour zone, yellow) (h). In all panels, each coloured line indicates the mean percent time avoiding the odour across densities, the black line indicates the simulation result for parameter values taken from real fly data, n = 10,902 for all data-points, and superimposed are the mean values for real flies (black circles).

