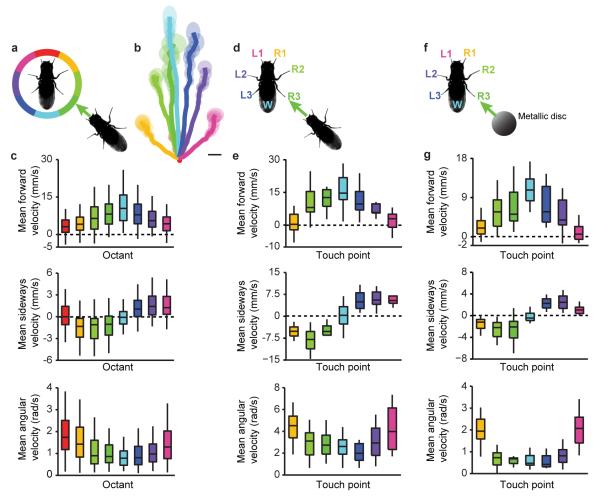
Extended Data Figure 3. Encounter Response kinematics for interfly or metallic disc touches.
a, Schematic of octant colour-coding. Each Encounter Response trajectory is assigned to the perimeter octant subsected by a line drawn to the nearest neighbouring fly during an Encounter. A head octant (red) is included here but these responses likely represent front leg touches. b, The mean (solid lines) and standard error (translucent areas) for Encounter Response trajectories (right) colour-coded by the relative location of the neighbouring fly as in panel a. The scale bar is 1 mm. c, Boxplot of mean forward (top), sideways (middle), and angular (bottom) velocities for the first 0.5 s of Encounter Responses (n = 112-244 Encounters with duration >0.5 s) in the olfactory avoidance experiment from Fig. 1d (density = 0.75 flies/cm2). Velocities are colour-coded by octant. d, Schematic of touch-point colour-coding for high-resolution inter-fly touch response experiments. Each walking trajectory is colour-coded by the appendage touched by a neighbouring fly. Data is from Fig. 3c. e, Boxplot of mean forward (top), sideways (middle), and angular (bottom) velocities for the first 0.16 s of touch responses. Velocities are colour-coded by touch-point. f, Schematic of touch-point colour-coding for mechanical touch response experiments. Each touch response trajectory is assigned to the appendage touched by a metallic disc. Data is from Fig. 3d. g, Boxplot of mean forward (top), sideways (middle), and angular (bottom) velocities for the first 0.5 s of touch responses. Velocities are colour-coded by touch-point.

