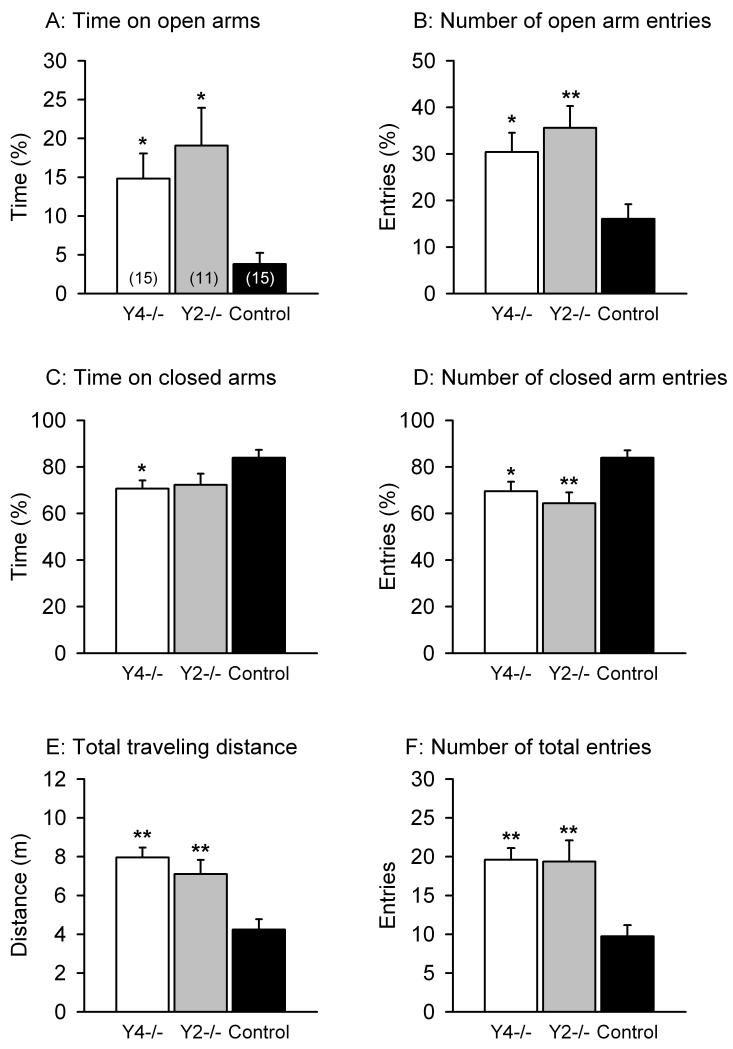
Figure 3.
Behavior of Y4−/−, Y2−/− and control mice in the EPM test. The graphs show the time spent on the open arms (A), the number of entries into the open arms (B), the time spent on the closed arms (C), the number of entries into the closed arms (D), the total distance traveled in the open and closed arms (E) and the total number of entries into any arm (F) during the 5 min test session. The time spent on the open or closed arms is expressed as a percentage of the total time spent on any arm, and the number of entries into the open or closed arms is given as a percentage of the total number of entries into any arm during the 5 min test session. The values represent means ± SEM, n as indicated in brackets. *P < 0.05, **P < 0.01 versus control mice.

