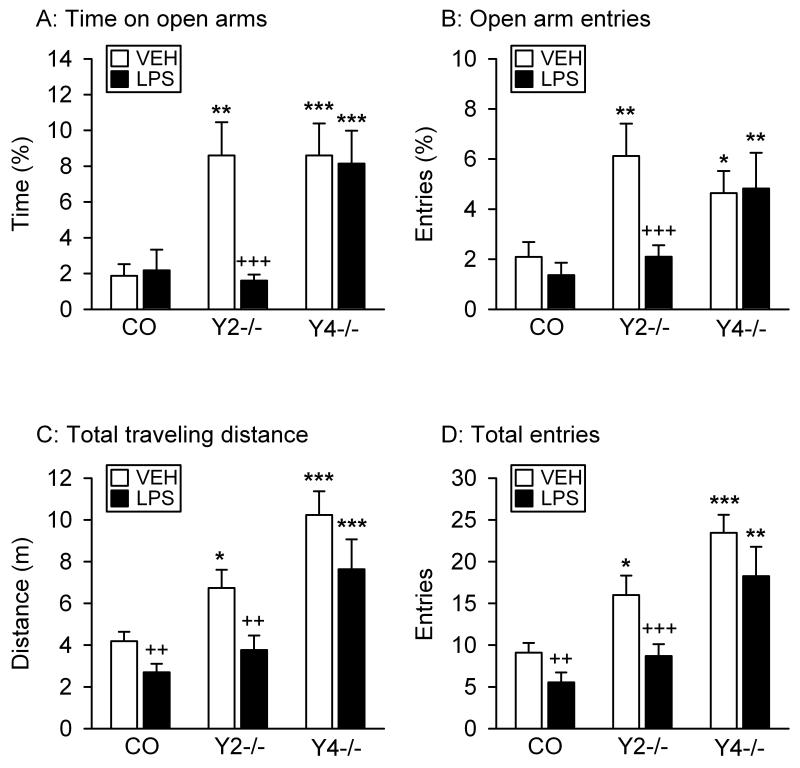
Figure 1.
Effect of LPS on the behavior of control (CO), Y2−/− and Y4−/− mice in the EPM test. LPS (0.1 mg/kg) or vehicle (VEH, sterile saline) was injected IP 2.5 h before the behavioral test. The graphs show (A) the time spent on the open arms, (B) the number of entries into the open arms, (C) the total distance traveled, and (D) the total number of entries into any arm. The parameters in panels A and B are expressed as a percentage of the total time spent on any arm and of the total number of entries into any arm, respectively. The values represent means ± SEM, n = 8 – 11. * P ≤ 0.1, ** P < 0.05, *** P < 0.01 versus control mice with the same treatment, ++ P < 0.05, +++ P < 0.01 versus vehicle-treated mice of the same genotype.

