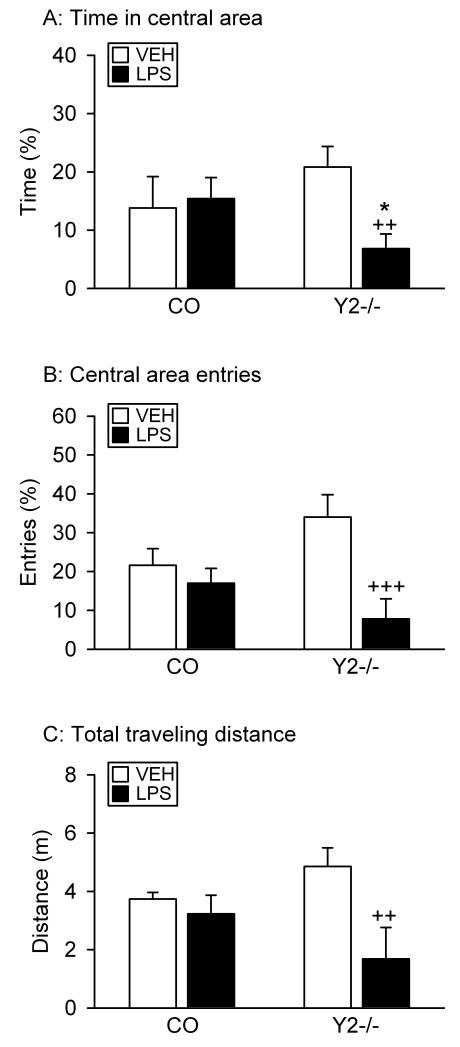
Figure 7.
Effect of a high dose of LPS on the behavior of naïve control (CO) and Y2−/− mice in the OF test. LPS (0.83 mg/kg) or vehicle (VEH, sterile saline) was injected IP 2.5 h before the behavioral test. The graphs show (A) the time spent in the central area, (B) the number of entries into the central area, and (C) the total distance traveled. The parameters in panels A and B are expressed as a percentage of the total time spent in the OF and of the total number of entries into any zone, respectively. The values represent means ± SEM, n = 5. * P ≤ 0.1 versus control mice with the same treatment, ++ P < 0.05, +++ P < 0.01 versus vehicle-treated mice of the same genotype.

