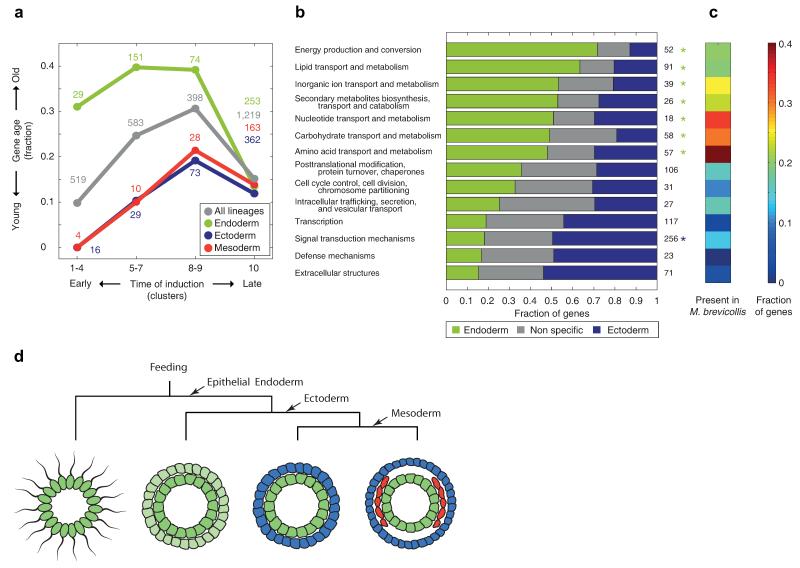
Figure 4. The germ layers exhibit distinct gene ages and functional category enrichments.
a, Fraction of ‘old’ genes – defined as presence of orthologs in other opisthokont Eukaryotes – across the indicated temporal induction clusters and germ layers. Different gene age thresholds show similar results (Extended Data Fig. 6). b, For the shown functional categories, the bars indicate the fraction of genes in the endoderm gene set, ectoderm gene set, and other dynamic and zygotically expressed genes. Asterisks indicate significant endoderm (green) and ectoderm (blue) enrichments (P<0.01, Hypergeometric distribution). c, The fraction of orthologs in M. brevicollis is indicated for each functional category. d, A model for germ layer evolution.

