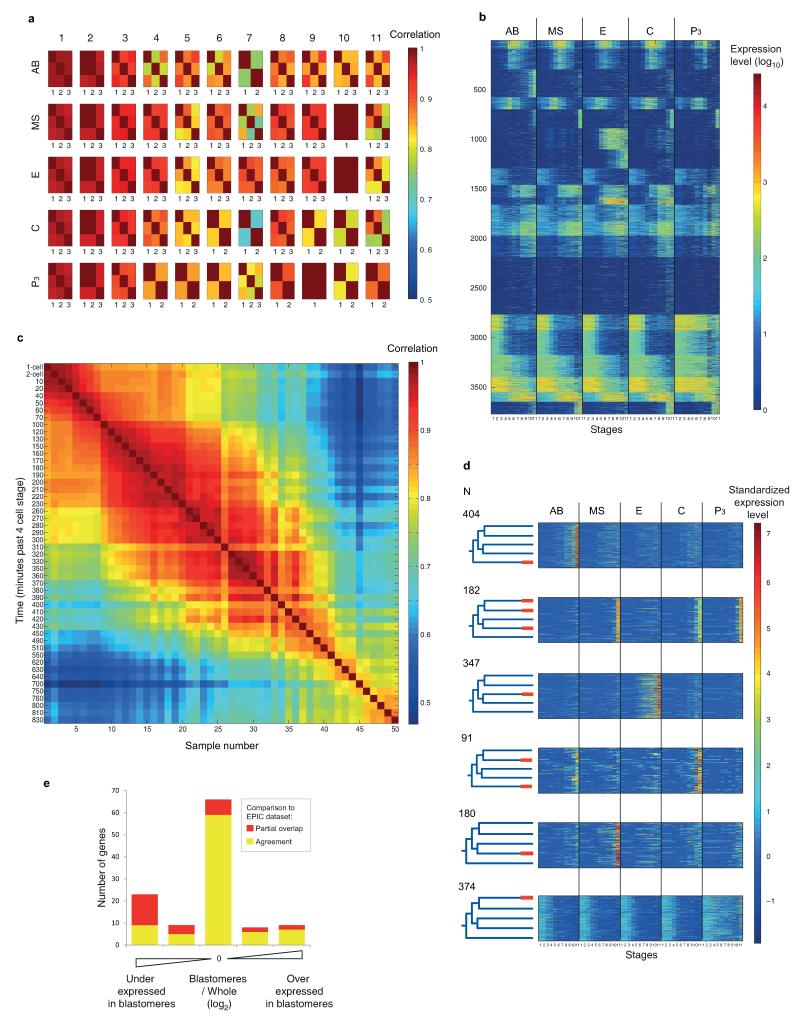
Extended Data Figure 2. A transcriptomic survey of C. elegans embryonic founder cell lineages.
a, Replicates of the embryonic blastomere time-courses. The heatmaps show the correlations among the replicates for each blastomere lineage at each of the eleven examined stages. For three blastomere/stages there were no replicates. The median correlation coefficient is 0.9. Samples were collected in triplicates. Only samples with at least 750,000 reads were used which has been previously shown to be of sufficient sequencing depth for CEL-Seq12. Supplementary Table 3 provides the sequencing statistics for each sample. b, Expression profiles of the 3,910 dynamic genes across the blastomere lineage time-courses. See methods for definition of dynamic genes. c, Correlation coefficients between samples of the whole embryo time-course. Each of the 50 samples comprises a single embryo, collected at the indicated minutes past the 4-cell stage. Again, only samples with at least 750,000 reads were used and Supplementary Table 3 provides the sequencing statistics for each sample. d, The expression profiles of the 1,664 genes with differentiated expression analyzed in Figure 1c. Each profile was “standardized” by subtracting its mean and dividing by its standard deviation. e, Comparison of the blastomere time-courses to the EPIC dataset15. For 115 genes, we could compare gene expression to previously published embryonic expression profiles generated by microscopic lineaging until the ~300-cell stage15,39. Of these, 75% of our profiles had consistent localized expression (Supplementary Table 1). Of those, 54% matched completely, and 21% of the genes, expressed in all of the lineages in our dataset had some missing expression in the EPIC dataset because the lineaging was not carried out until the end of the developmental process. The remaining genes have some overlap in expression. Such differences in expression could be caused by the transgene in the EPIC dataset not recapitulating the profile of the endogenous gene, or missing signals between cells in the blastomere dataset, as is seen from the whole embryo/blastomeres expression level ratio (See Supplementary Table 1, ratios defined as equal, slightly higher/lower or much higher/lower). Expression profile compared to the EPIC dataset deviates more when expression in the blastomeres is low compared to the whole embryo, but the blastomere dataset has the advantage that all genes are assayed simultaneously, no transgenes are used, maternal transcripts are seen, and down-regulation of genes is observable.

