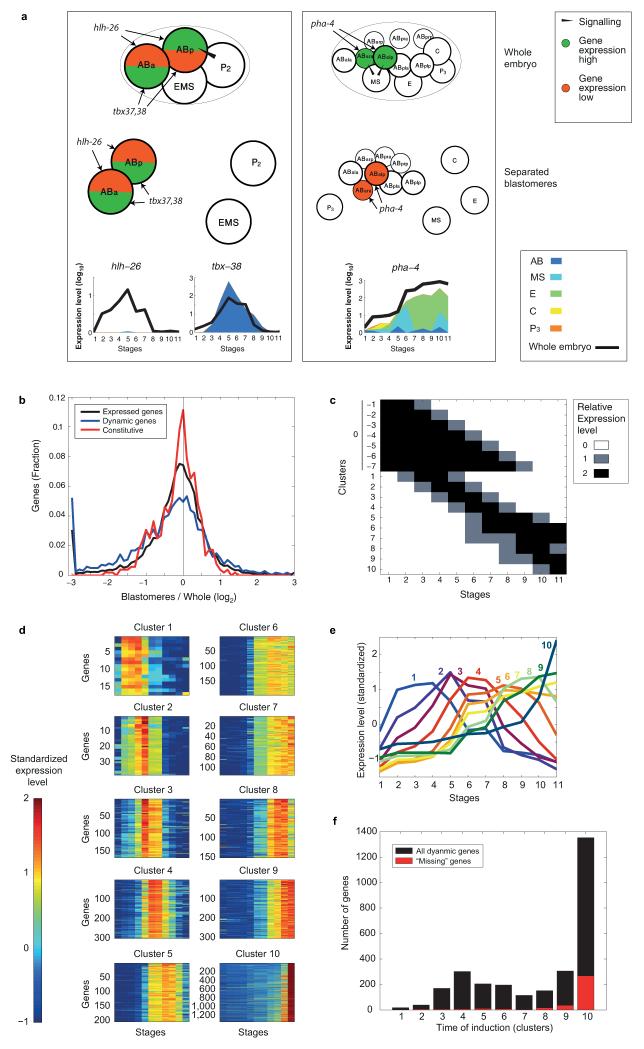
Extended Data Figure 3. Lineage restricted gene expression identifies genes dependent upon coherence of the lineages and tissue specificity.
a, Expression profiles of genes involved in pharynx specification. The left and right panels correspond to the two Notch signaling events. The top and bottom images correspond to the expected regulatory patterns in the whole embryo and isolated blastomeres, respectively. tbx-37 is not shown since it is identical to tbx-38 in expression profile. b, Comparison of the overall sum of expression between the two time-courses, plotted on a log2 scale (black). Genes “missing” in the separated lineage time-course were manually added to the graph at −3. The additional plots indicate the same measure for dynamically expressed genes (blue) and constitutive genes (red). c, Idealized expression profiles used to identify gene expression clusters. d, The gene expression profiles for the temporally restricted gene expression profiles. Each profile was “standardized” by subtracting its mean and dividing by its standard deviation. e, Average expression profiles of ten clusters of dynamically expressed genes determined based upon the whole embryo expression data (see Methods). f, The number of dynamic genes in each temporal period In each group, the genes not expressed in the lineage time-course (b) are marked in red.

