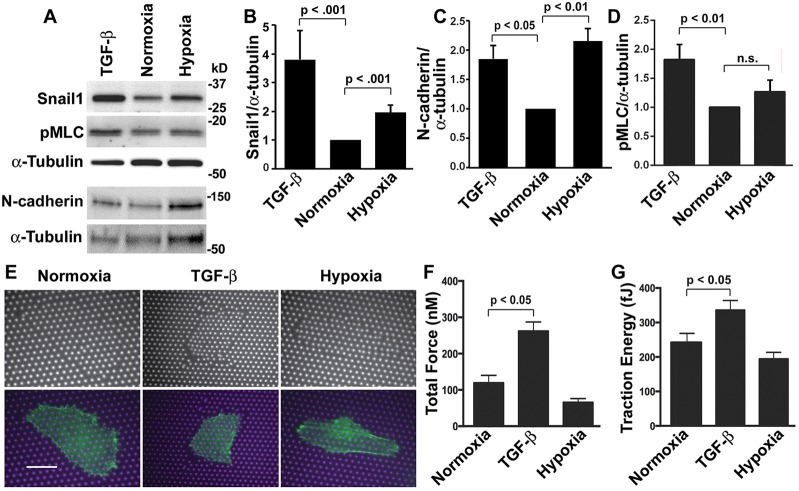
Fig. 2.
TGF-β but not hypoxia increases cell contractility. (A) Immunoblots of lysates from normoxia control HK2 cells and cells treated with TGF-β or maintained at 1% oxygen (hypoxia) for 48 h and probed with antibodies for Snail-1, pMLC-Thr18/Ser19 and N-cadherin, and for α-tubulin as a loading control. (B–D) Quantified immunoblot signal for Snail1 (B), N-cadherin (C) and pMLC (D) normalized to the α-tubulin loading control and expressed relative to normoxia controls. Data are mean±s.e.m. of seven independent cell preparations for Snail1, three for N-cadherin and five for pMLC. Statistical differences were determined by the Student's t-test. (E) HK2 cells expressing LifeAct–GFP were plated on micromolded PDMS micropost arrays and treated with TGF-β or hypoxia for 48 h. Phase-contrast and fluorescence images are shown in the top and bottom panels, respectively. Merged fluorescence images of microposts (magenta) and cells expressing LifeAct–GFP (green). Scale bar: 15 µm. (F,G) Total force (F) and traction energy (G) quantified from cells plated on microposts. Data are the mean±s.e.m. of >10 cells for each condition in three independent cell preparations.

