Fig. 4.
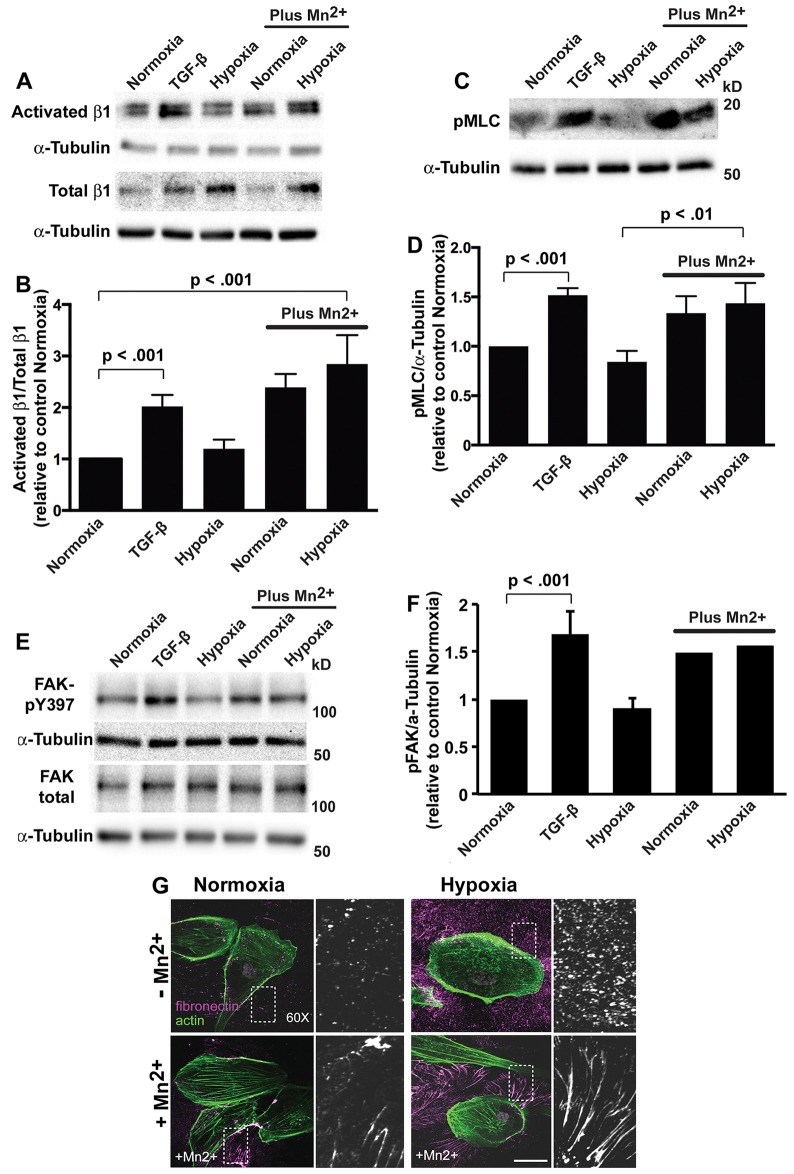
Activating integrins increases pMLC and fibrillogenesis with hypoxia. (A) Immunoblots for activated and total β1 integrin in lysates from HK2 cells treated for 48 h with TGF-β, exposed to hypoxia or, as indicated, in the presence of 25 µM MnCl2. (B) Quantification of the β1 integrin signals normalized to α-tubulin, calculated as the ratio of activated to total β1-integrin and expressed relative to normoxia controls in the absence of MnCl2. Data are mean±s.e.m. of five independent cell preparations. (C) Immunoblots for pMLC-Thr18/Ser19 (pMLC) in lysates from HK2 cells treated for 48 h with TGF-β, exposed to hypoxia or, as indicated, in the presence of 25 µM MnCl2. (D) Quantified pMLC signal normalized to α-tubulin and expressed relative to normoxia controls in the absence of MnCl2. Data are mean±s.e.m. of three independent cell preparations. (E) Immunoblots for pFAK-Y397 and total FAK in lysates from HK2 cells treated as indicated and described in A and C. (F) Quantified pFAK signal normalized to α-tubulin and expressed relative to normoxia controls in the absence of MnCl2. Data are mean±s.e.m. of three determinations for normoxia, TGF-β and hypoxia in the absence of MnCl2 and averages of two determinations for normoxia and hypoxia with 25 µM MnCl2. (G) HK2 cells with normoxia (controls) and upon hypoxia maintained in the absence or presence of 25 µM MnCl2 for 48 h. Cells were labeled with antibodies for fibronectin (magenta) and stained for actin filaments with rhodamine (green). A magnified view on the boxed area is shown on the right. Scale bar: 20 µm.

