
Fig. 6.
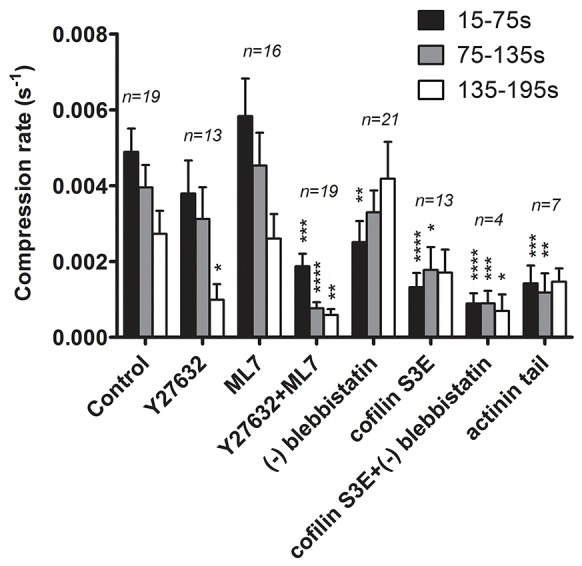
Vesicle compression rates after genetic or pharmacological inhibition of proteins participating in actin coat compression. Compression rates were calculated for 60-s intervals during vesicle compression as described in the Materials and Methods section. Compression rates are shown as mean±s.e.m. and the numbers indicate the number of vesicles. *P<0.05, **P<0.01; ***P<0.001, ****P<0.0001.