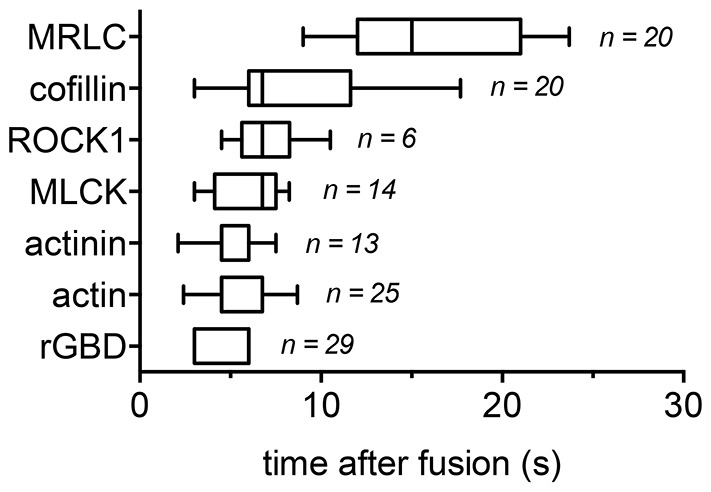
Fig. 7.

Chronology of protein recruitment to the lamellar body membrane after fusion. The time of fluorescence intensity increase was measured for fluorescently labelled proteins in the region of interest around the fusing lamellar body with respect to fusion start. The time point of fusion was determined by decrease in LysoTracker fluorescence. (n indicates the number of fused vesicles). The box represents the 25–75th percentiles, and the median is indicated. The whiskers show the 10–90th percentiles.
