Fig. 3.
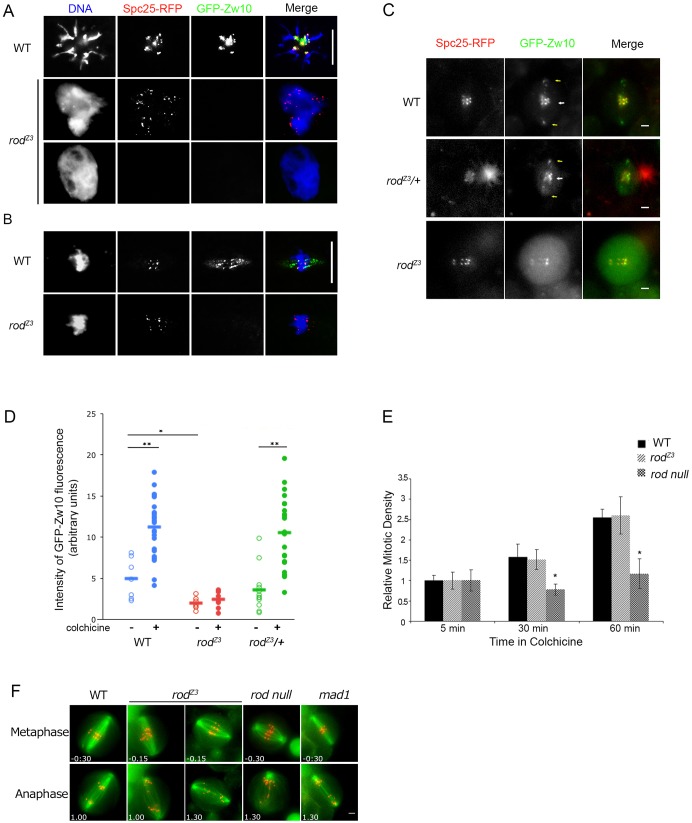
RZZ kinetochore recruitment is absent in rodZ3-derived embryos but present, although reduced, in homozygous rodZ3 neuroblasts. (A) RZZ does not localize to polar bodies in rodZ3-derived embryos. Polar bodies from fixed WT and rodZ3-derived syncytial embryos expressing Spc25–RFP (a kinetochore marker, red), GFP–Zw10 (an RZZ component, green) and stained for DNA (blue). Scale bar: 10 µm. (n = 12 polar bodies examined, all negative.) (B) RZZ does not localize to metaphase kinetochores or spindle fibers in rodZ3-derived embryos. Scale bar: 10 µm. (n = 30 metaphases, all negative, from 12 embryos). (C) RZZ is recruited to kinetochores in rodZ3 larval neuroblasts, but at reduced levels. In WT or rodZ3 heterozygous neuroblasts GFP–Zw10 localizes to kinetochores (marked by Spc25–RFP) and spindle fibers. In homozygous rodZ3 cells (bottom), GFP–Zw10 is detectable at kinetochores, but at lower intensity. Particles of RZZ are visible between the kinetochores (white arrow) and the poles (yellow arrows) in WT and heterozygous rodZ3, but not in homozygous rodZ3, suggesting a problem with dynein-dependent streaming (see also Fig. 5). Scale bars: 2 µm. (D) Quantification of RZZ levels on kinetochores. The GFP–Zw10 signal, normalized to that of Spc25–RFP, was determined for WT (blue, n = 7, ncolch = 26), rodZ3 homozygous (red, n = 7, ncolch = 8) or rodZ3/+ heterozygous (green) cells. Closed circles and open circles indicate cells treated or untreated, respectively, with colchicine for 15 min. Results are mean±s.e.m. *P<0.05, **P<0.01 (Student's t-test). (E) The SAC is functional in rodZ3 larval brains. Relative mitotic density in larval brains as a function of time in colchicine. WT (black), rodZ3 (light gray), rod null (dark gray). Results are mean±s.e.m. *P<0.05 (Student's t-test, using at least five larval brains per experiment). In rodZ3, the mitotic density increases as a function of time in colchicine similar to WT, whereas in SAC-defective rod null brains, mitotic cells do not accumulate, even after 1 h in colchicine. (F) Lagging chromatids are common in rodZ3 neuroblast mitosis. Representative images of single live neuroblasts of the indicated genotypes in metaphase and anaphase. Kinetochores are visualized with Spc25–RFP (red) and the spindle is marked with GFP–Jupiter (green). Indicated times (min:seconds) are relative to anaphase onset (see also Table 3). Scale bars: 2 µm.

