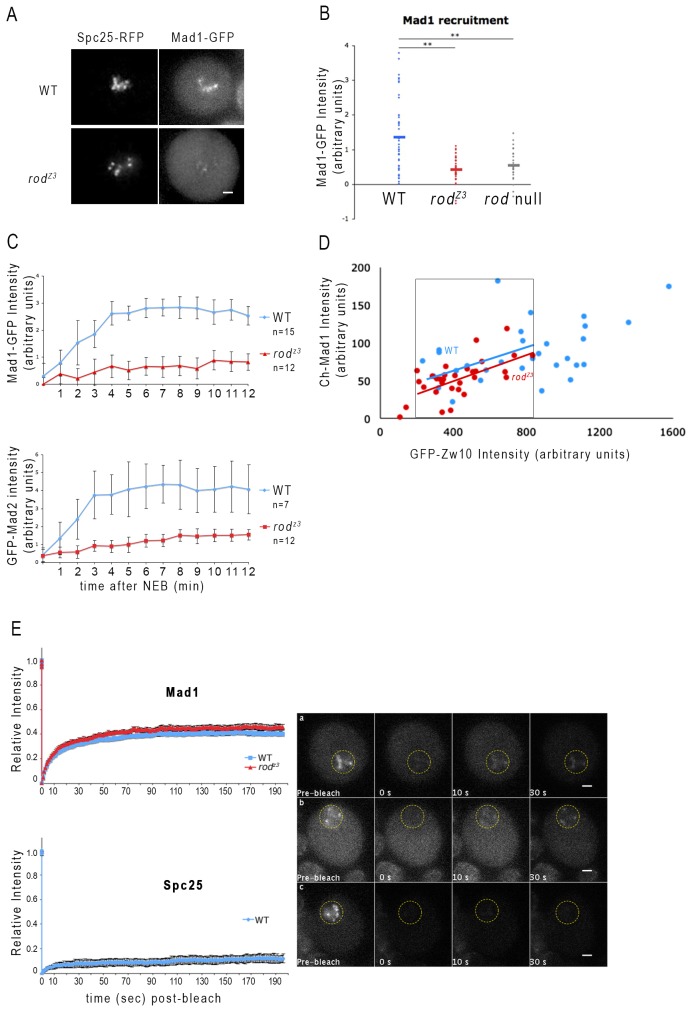
Fig. 4.
Mad1 kinetochore recruitment is slow, but its steady state dynamics are normal in rodZ3 neuroblasts. (A) Images of live WT (top) or rodZ3 (bottom) prometaphase neuroblasts expressing Mad1–GFP and Spc25–RFP. Scale bars: 2 µm. (B) Quantification of Mad1–GFP kinetochore recruitment, normalized to Spc25–RFP in untreated WT (blue, n = 43), rodZ3 (red, n = 44), or rod-null (gray, n = 29) cells. Horizontal bars represent the mean. In most rodZ3 cells, little or no Mad1 is detectable at kinetochores, similar to rod null. **P<0.01; Student's t-test. (C) Mad1–GFP (top) and GFP–Mad2 (bottom) accumulate slowly on kinetochores, but reach substantial levels in colchicine-treated rodZ3 neuroblasts. GFP signals of kinetochore Mad1 or Mad2 were monitored in individual, colchicine-treated WT (blue) or rodZ3 (red) neuroblasts, normalized to Spc25–RFP, and plotted as a function of time after nuclear envelope breakdown (NEB). The maximum accumulation is about 35% that of WT. P<0.05 (Student's t-test). (D) The relationship between Mad1 and RZZ levels is unchanged in rodZ3 cells. Larval brains expressing Cherry (Ch)–Mad1 and GFP–Zw10 were imaged after a 30-min colchicine treatment. The intensities of kinetochore Cherry and GFP were quantified in individual WT (blue) or rodZ3 (red) cells. Levels of GFP–-Zw10, representing RZZ, were plotted on the x-axis and those of Ch–Mad1 were plotted on the y-axis. The two data sets show a similar correlation between Mad1 and RZZ. The regression curves shown for WT and rodZ3 fit the data points within the black box, which correspond to kinetochores displaying the range of GFP–Zw10 signals common to the two genotypes. The difference in slope is not significant (ANOVA test). (E) rodZ3 does not alter turnover dynamics of Mad1–GFP on unattached kinetochores. Left, FRAP analysis of WT (blue) or rodZ3 (red) neuroblasts expressing Mad1–GFP (top) or GFP–Spc25 (bottom) treated with colchicine for 15 min. Fluorescence recovery was monitored over 200 s and normalized to the pre-bleach signal. Neither the size of the fast-turnover pool of Mad1 (∼40%) nor its half-life (∼10 s) are altered in rodZ3 cells. The stable outer kinetochore component Spc25 was used as a control. Right, representative images of Mad1–GFP in (a) WT and (b) rodZ3 cells, and (c) GFP–Spc25 in WT cells, before and after photobleaching kinetochores. The bleached area is circled in yellow. Scale bars: 5 µm.

