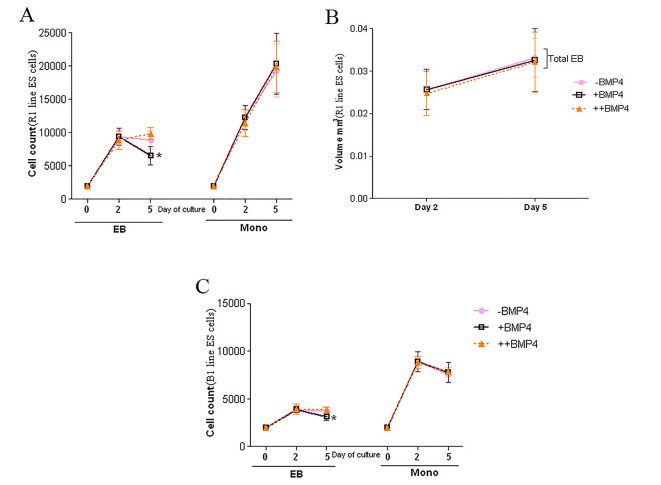
Figure 2.
Analyses of cell count and volume in EB and monolayer culture system. (A) The cell count of EB and monolayer culture conditions after 2 and 5 days of culturing R1 cell lines in different experimental conditions. (B) The comparison of the total volume of the R1 EBs cultured in different experimental conditions. (C) The cell count of EB and monolayer culture conditions after 2 and 5 days of culturing B1 cell lines in different experimental conditions. Data are expressed as mean±SD (*P<0.05).

