
Figure 2.
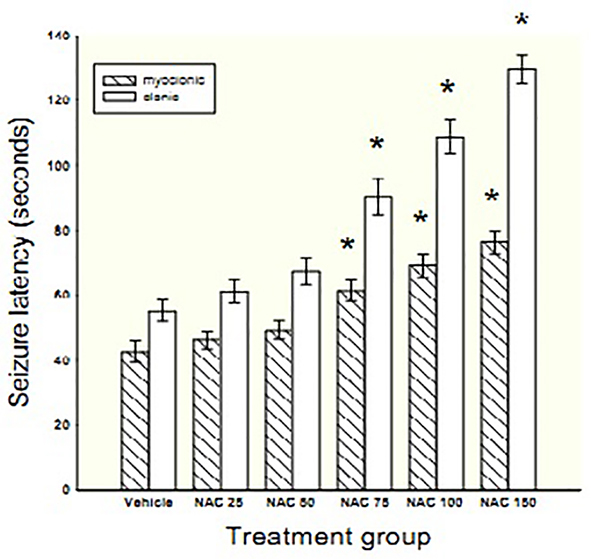
Bars represent mean±SEM of latency times to the onset of myoclonic and clonic seizures for 7 mice/group following chronic treatment with different doses of NAC (25-150 mg/kg) or vehicle. *Indicates significance (P<0.01) in comparison with vehicle