
Figure 3. Recurrently altered pathways in metastatic cSCC.
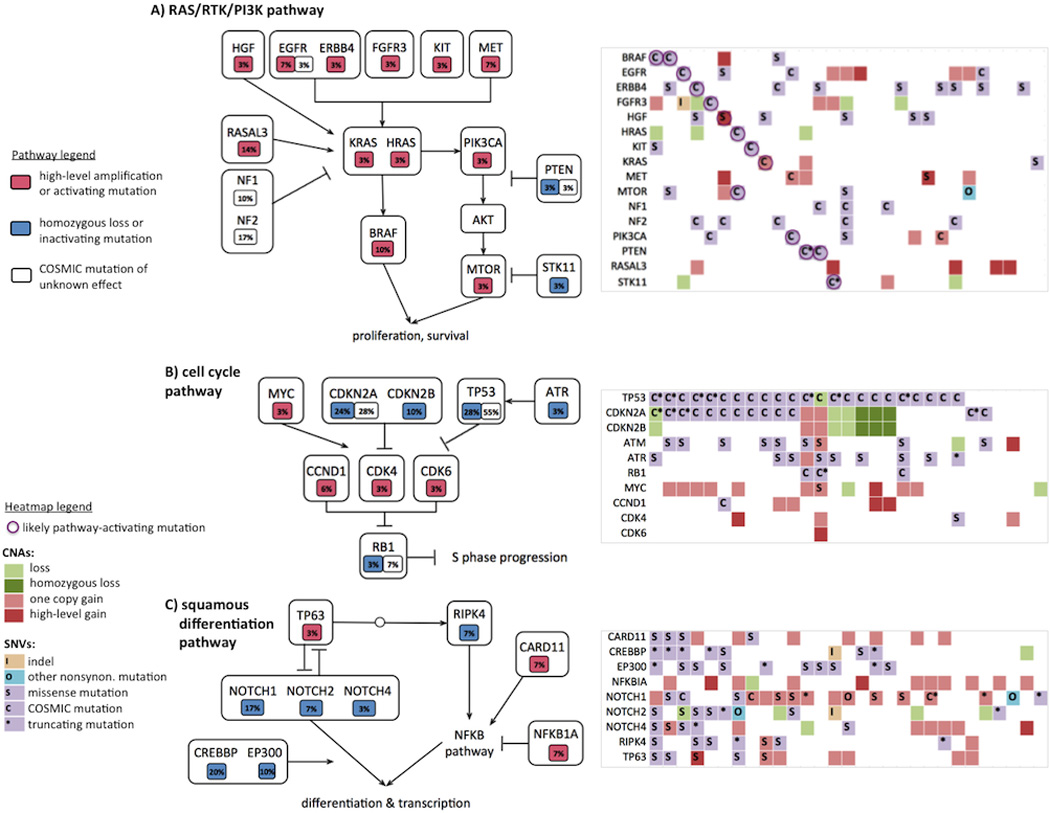
Pathway diagrams depicting the percentage of samples with alterations in
3A - RAS/RAF/MEK/ERK and PI3K/AKT signaling
3B - cell cycle, and
3C - squamous cell differentiation
Alterations are classified as activating (high-level amplification or known activating mutation colored red), inactivating (homozygous loss or truncating mutation colored blue), or potentially cancer associated (COSMIC mutation colored white). For each pathway, we show integrated heatmaps (similar to Fig 1B) to show the detailed alteration pattern of each gene; however, we now also include light red and light green to represent low-level CNAs. Note that each heatmap is sorted independently across the samples, to best illustrate the pattern of mutations, such as mutual exclusivity or concurrence.