Fig. 4.
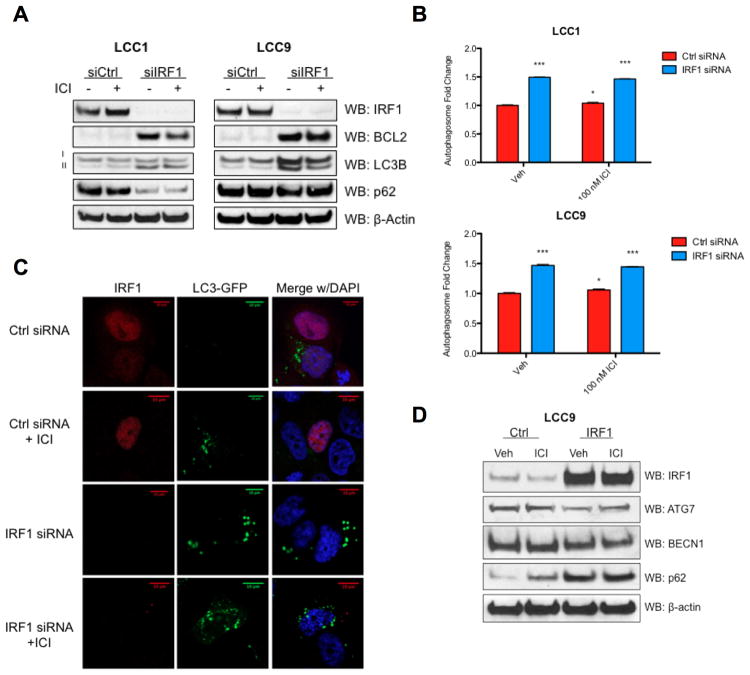
IRF1 knockdown induces autophagy. A, LCC1 and LCC9 cells were transfected with IRF1 siRNA and treated with 100 nM ICI for 48 hours. Western blot analysis of protein homogenates was used to measure expression of IRF1, BCL2, LC3B, and p62. B, Autophagosome formation assay in LCC1 and LCC9 cells transfected with IRF1 or Ctrl siRNA and treated with 100 nM ICI. Data are presented as percentage of total cells positive for green fluorescence; n = 3; *P < 0.05, ***P < 0.001 versus control/vehicle experiment. C, LCC1 cells were transfected with IRF1/Ctrl siRNA and LC3-GFP and then treated with ICI. D, LCC9 cells were transfected with IRF1 or control cDNA and treated with 100 nM ICI. Representative Western blot images of indicated proteins. Equivalent protein loading was assessed by measuring β-actin. n = 3 independent experiments.

