
Figure 3. ABT promotes alternative activation of macrophages.
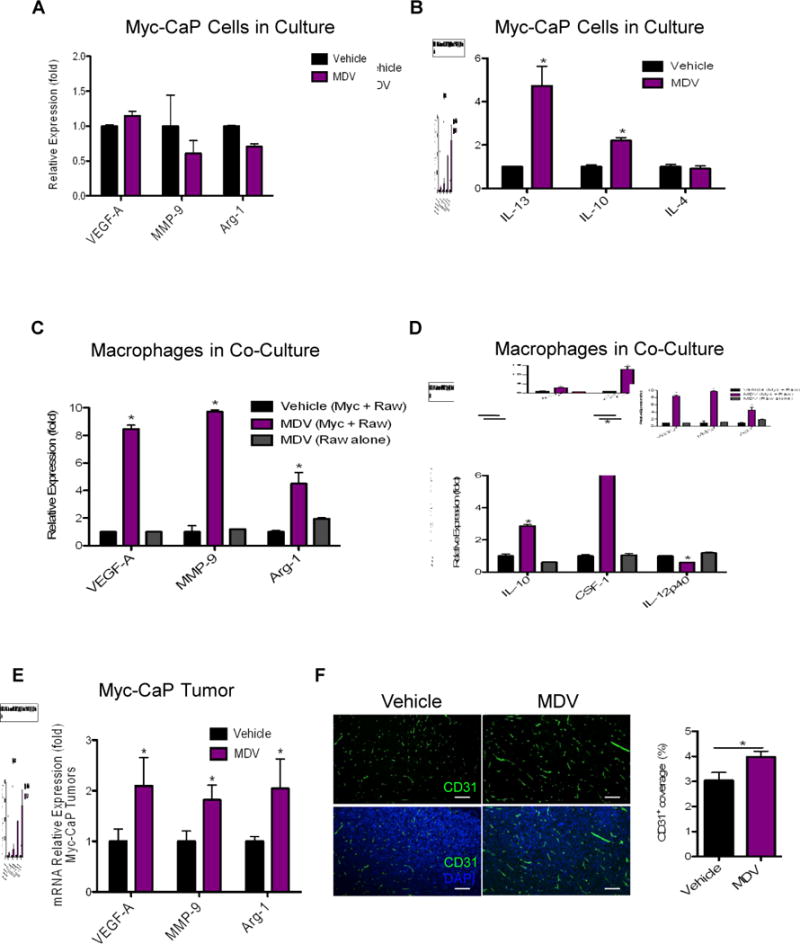
A-B) Relative gene expression in Myc-CaP tumor cells treated with MDV3100 (10 μM) for 48 hrs, normalized to vehicle treated control. C-D) RAW264.7 macrophages were co-cultured with Myc-CaP tumor cells or grown alone and treated with vehicle or MDV3100 (10 μM) for 48 hrs. Gene expression in RAW264.7 macrophages were normalized to co-cultured and vehicle-treated macrophages. E) Relative gene expression in MDV-treated Myc-CaP tumors normalized to control vehicle-treated tumors (level=1), as analyzed by RT-PCR. (n = 6–10 per group). F) Representative images of CD31 blood vasculature (green), DAPI (blue) IHF staining of treated Myc-CaP tumors. Right graph shows the quantification of CD31 staining in F shown as percent area covered (n = 4 per group). Scaled bars represent 100 μm. *P < 0.05.