
Figure 5. CSF1R Blockade lowered TAM-induced tumorigenic factors and delayed the emergence of CRPC.
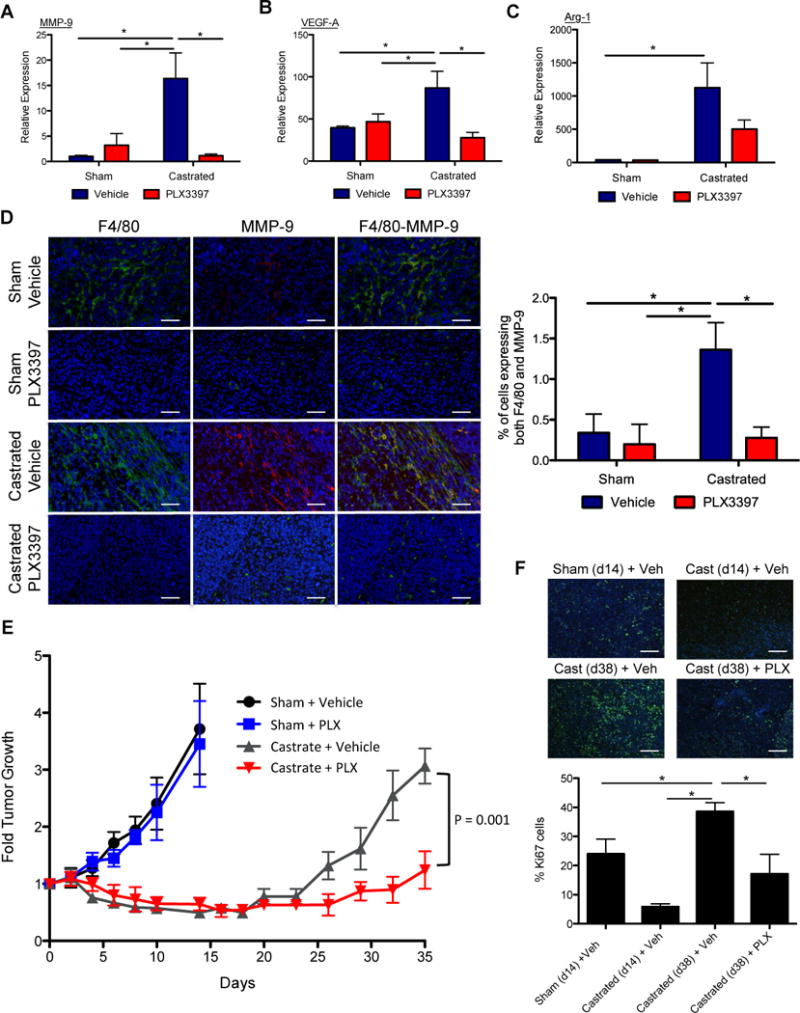
A) The impact of 4 treatment groups as noted in Figure 4 on the expression level of MMP-9, VEGF-A, and Arg-1 in the tumor. B) Representative IHF images of treated Myc-CaP tumor sections showing staining for nuclei (DAPI in blue) with F4/80 macrophages (green, left panels), or with MMP-9 (red, middle panels) singly and overlaid of all 3 stains (right panels). Right graph shows the quantification of percent of cells expressing both F4/80 and MMP-9. Scaled bars represent 100 μm. E) The impact of 4 treatments on tumor growth, expressed as fold change over start of treatment (day 0). F) The tumor proliferation rate for treated tumors was assessed by Ki67 staining. Representative IHF images from sham tumors (day 14), day 14 post-castration, and day 38 post-castration without or with PLX3397 treatment (Cast (day 38) + veh, Cast (day 38) + PLX) were shown. Ki67 (green) and DAPI (blue). Scaled bars represent 100 μm. The right graph shows the quantification of Ki67 staining for each condition, time point (total Ki67/total nuclei, n = 5). *P < 0.05. (n = 6–10 per group).