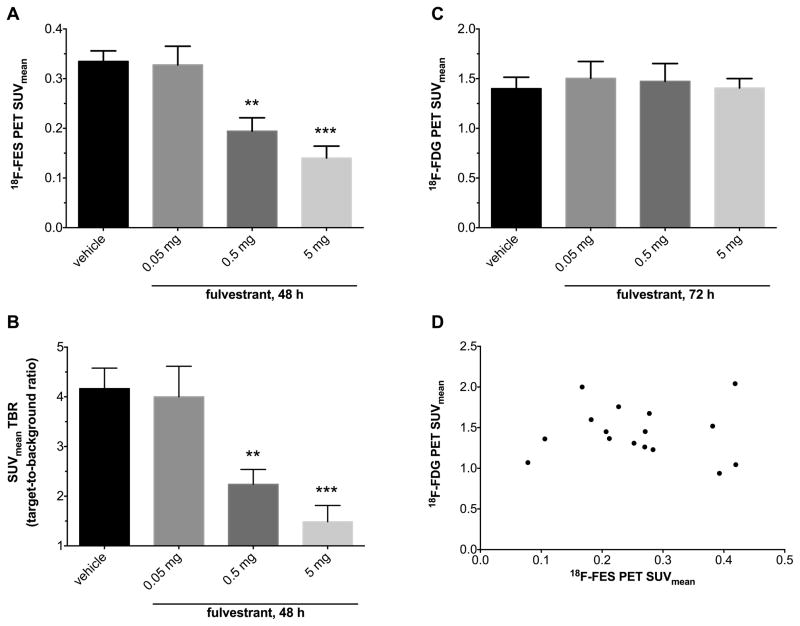
Figure 5.
Quantitative in vivo imaging. Mean standardized uptake values (SUVmean) (A) and target-to-background ratio (TBR) (B) of xenografts in 18F-FES PET scans 48 hours after fulvestrant treatment. There was a significant reduction in 18F-FES SUVmean and TBR with fulvestrant treatment (ANOVA p=0.0001). Holm-Sidak’s multiple comparison test revealed decreased uptake in intermediate and high dose groups compared to vehicle control. (C) 18F-FDG PET scans performed 24 hours after 18F-FES PET did not reveal any difference in SUVmean of xenografts among treatment groups (ANOVA p=0.94); (D) Pearson correlation between SUVmean from serial FES and FDG PET on select mice showing essentially no correlation between two scans (n=3–5/group, R2=0.0014, P=0.89). n=5–6 mice per group; **p<0.01, ***p<0.001; n=5–6 mice per group. Error bars are SEM.

