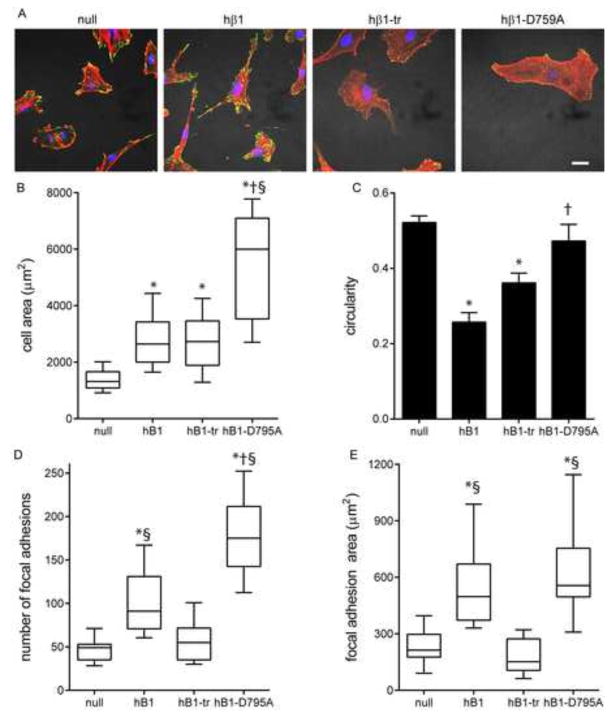
Figure 4. β1 tail regulates cell spreading, morphology and FA assembly.
(A) Immunostained images for vinculin (green) and actin (red). Scale bar, 10 μm. (B) Cell spread area, box-whisker plot (mean, 10th, 25th, 75th, and 90th percentile). * p<0.001 vs. null, § p<0.001 vs. hβ1-tr, † p<0.01 vs. hβ1. (C) Cell circularity. * p<0.001 vs. null, § p<0.001 vs. hβ1-tr. (D) Number of FA, box-whisker plot (mean, 10th, 25th, 75th, and 90th percentile). * p<0.001 vs. null, § p<0.01 vs. hβ1-tr, † p<0.01 vs. hβ1. (E) Total FA area, box-whisker plot (mean, 10th, 25th, 75th, and 90th percentile). * p<0.001 vs. null, § p<0.001 vs. hβ1-tr.

